
There are numerous tools to see the CPU, RAM and other resource usage on Linux.
The simplest and most popular is the top command, perhaps. Then there is htop, btop, glances and many more.
There is one major problem with these tools. They show the current stats.
As a sysadmin, you need to know the stats from the past as well. It helps troubleshoot performance related issues.
In this tutorial, I'll discuss a few ways you can view the historical system resource usage in Linux.
Use the classic sar command
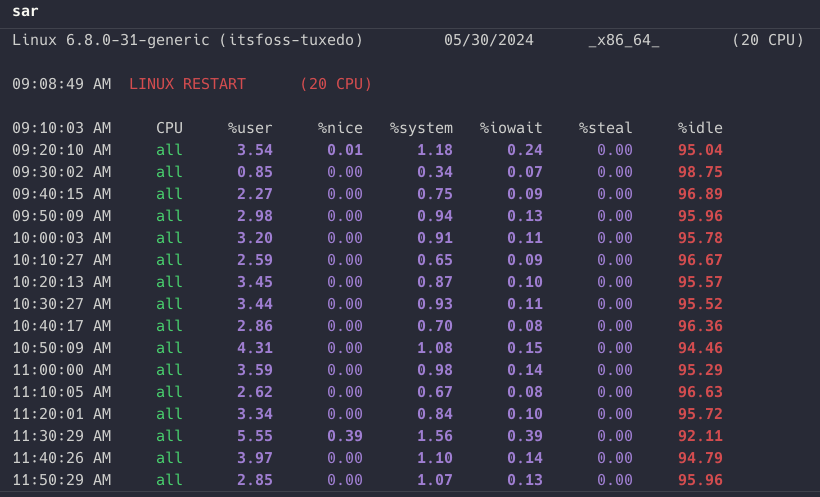
The sar command lets you monitor as well as collect performance data of various Linux subsystems such as CPU, memory, I/O.
By default, it shows and stores the resource usage every 10 minutes:
That's not it. It even stores the statistics in the /var/log/sysstat directory in the format of saXX per day. The XX in the filename is day in date. So, the stats for 13th May are in the file sa13.
ls -l /var/log/sysstat/
total 836
-rw-r--r-- 1 root root  77616 May 13 17:20 sa13
-rw-r--r-- 1 root root 104564 May 14 17:30 sa14
-rw-r--r-- 1 root root 115828 May 15 12:50 sa15
-rw-r--r-- 1 root root 221064 May 16 17:00 sa16
-rw-r--r-- 1 root root 154068 May 18 16:10 sa18
-rw-r--r-- 1 root root 148068 May 30 15:40 sa30
Why does it store the stats in /var/log/sysstat directory? Because the package that installs the sar command is sysstat:
sudo apt install sysstatYou can use various options with the sar command to get only CPU, memory, IO stats or change the time interval for the stat collection.
The problem is that viewing stats in tabular format is not very user-friendly. Although sar doesn't provide the option to view the stats in graphs, you can use third-party tools like SARchart to show the same stats in graphs and charts.
But that's an additional effort and it becomes even more painful if you have to do it on multiple servers.
This is why I prefer the next solution.
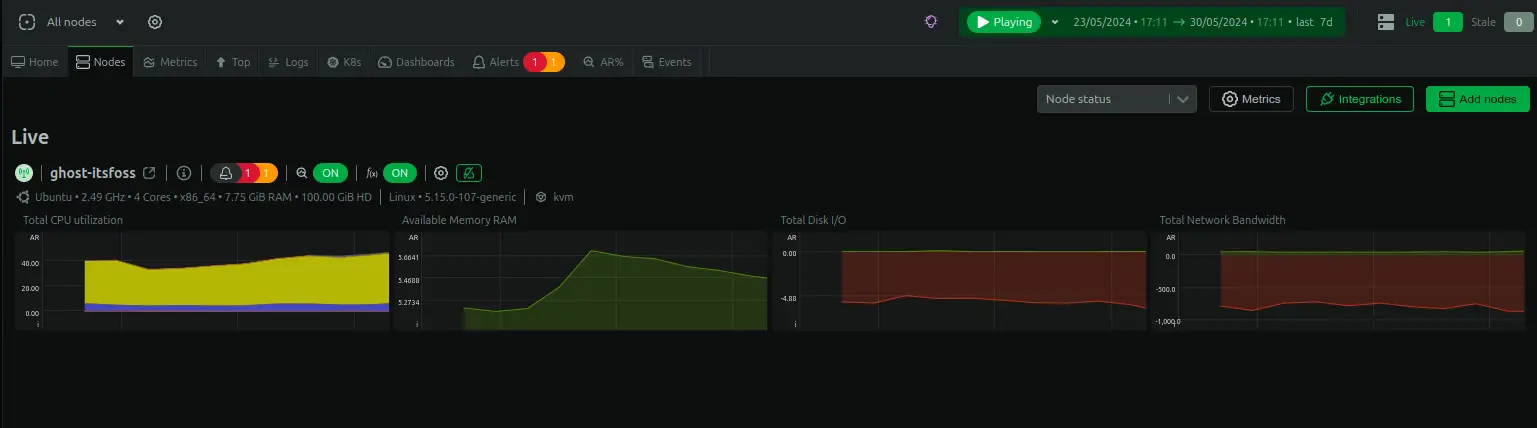
Use the modern Netdata tool
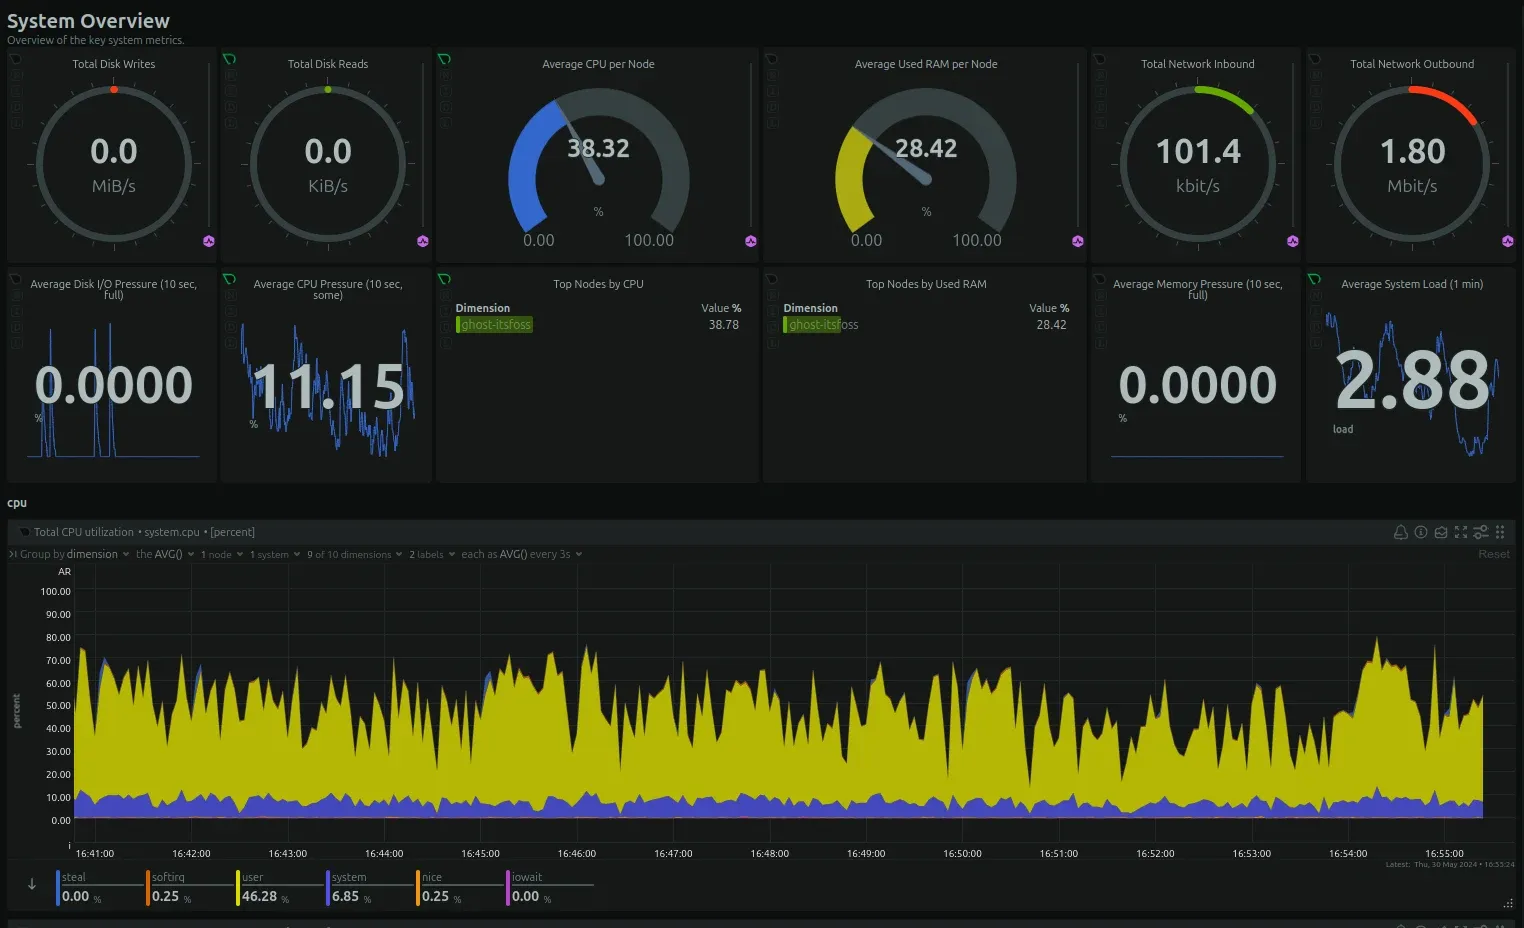
Netdata is an open source monitoring solution that gives you a bird-eye view of your Linux servers in a beautoful dashboard.
It is web-based solution but the stats are not stored in clouds. Your data remains on your system itself, it is only viewed in the web interface on Netdata.
Not only it shows various system resource usage of your Linux servers in beautiful graphs, it can do a lot more that that. It can even let you view journald logs. How cool is that!
It alerts you via email when the system resource usage reach a critical level. You can also configure this critical level. I have custom alert set for disk space usage with Netdata and it works amazingly.
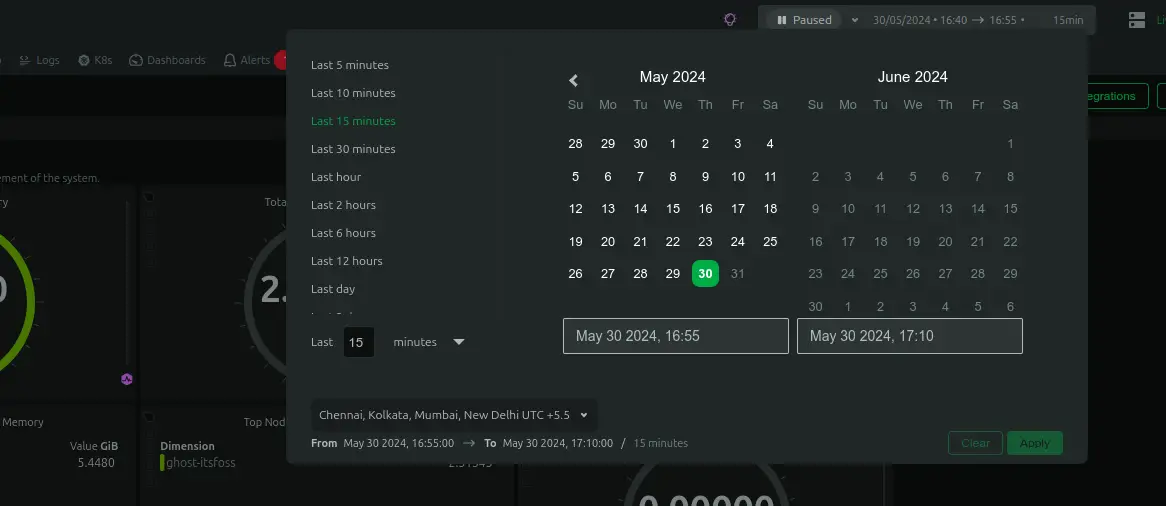
By default it shows the stats for the last 15 minutes but you can change that by choosing a different predefined time frame or a custom one from the calendar.
To use Netdata, you’ll have to sign-up with them. The Community program is free for 5 servers for personal usage. If you like it and if you can afford it, you should switch to a paid version to support this magnificent open source service.
Once you have signed up, log in to your account. In the empty space there, you'll be promoted to 'connect nodes'. When you click that, you can choose the platform where you want to install Netdata and copy the provided code.
It's basically a script that is downloaded using wget or curl and then it installs Netdata agent on your system. It doesn't require sudo access anywhere and that’s a good thing.


Once the Netdata agent is installed on your system, it starts collecting the stats which remains on your system. The stats are only viewed on the dashboards in your Netdata account.
Conclusion
If you use a cloud server like Linode or DigitalOcean, they also provide their own agents that can be installed to show the system stats in their respective dashboards.
Frankly speaking, using Netdata is so simple and it has so many features that once you start using it, it's difficult to switch to any other tool.
I let you decide which tool you tool you would like to use to see the history of your servers system's resource usage.