
Keeping an eye on the resource usage of your Linux system is a must for every Linux user.
System feel sluggish? Check the CPU usage. Web service taking too long to respond? Check the RAM usage.
The top command comes preinstalled on most systems and it works just fine. However, there are several other CLI tools that can be used for checking resource utilization.
After digging the web for more such tools, I prepared a list of 11 system monitoring tools for the Linux command line.
The list consists of some popular names and some modern tools that are yet to be known to the masses!
1. top
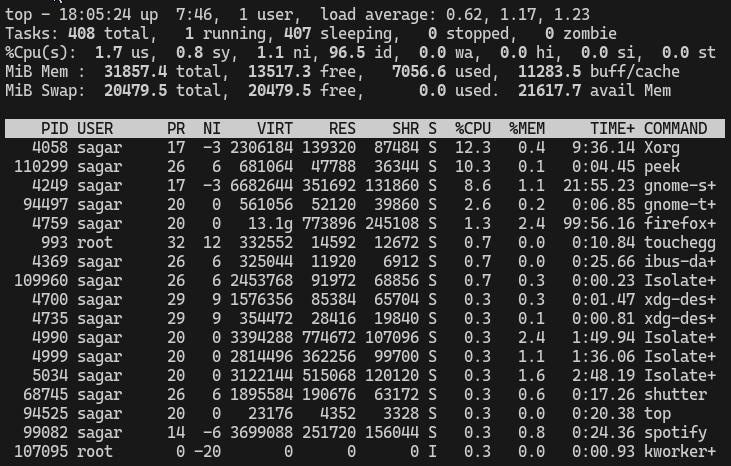
The top utility comes pre-installed with almost every Linux distribution and is popular amongst advanced users who quickly want to minor the overall performance.
While it is not the most beautiful and easy-to-use system monitoring utility, it is still the favorite of many advanced users as it comes pre-installed and can get almost every important information of your system.
2. htop
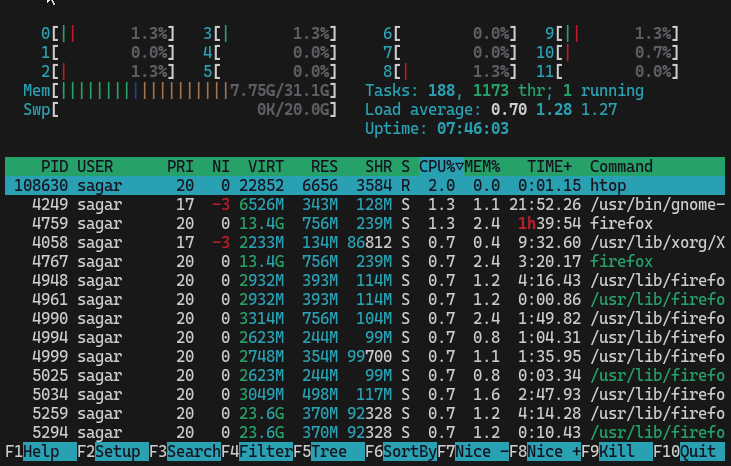
The htop is a modern alternative to the top command as it adds colors and lets you interact using the mouse (yes! a mouse).
Not only that, you can also kill annoying processes quite easily through multiple kill signals of Linux.
Being this popular, it is available in the default repository of almost every Linux distribution, and here's how you install it.
For Ubuntu/Debian:
sudo apt install htopFor RHEL/Fedora:
sudo dnf install htopFor Arch Linux:
sudo pacman -S htop3. bashtop
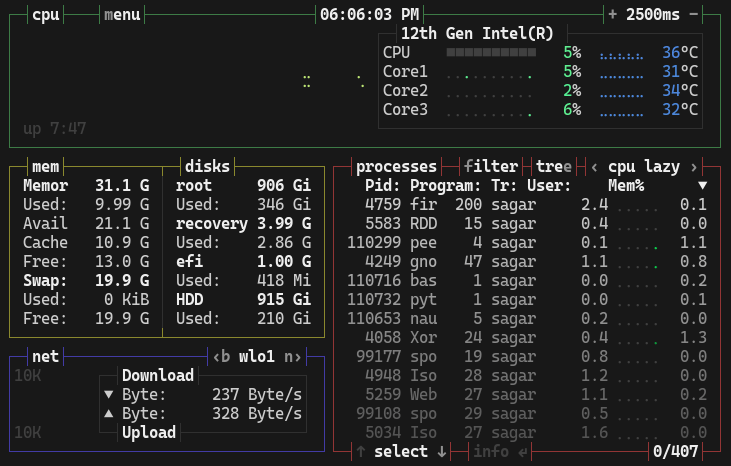
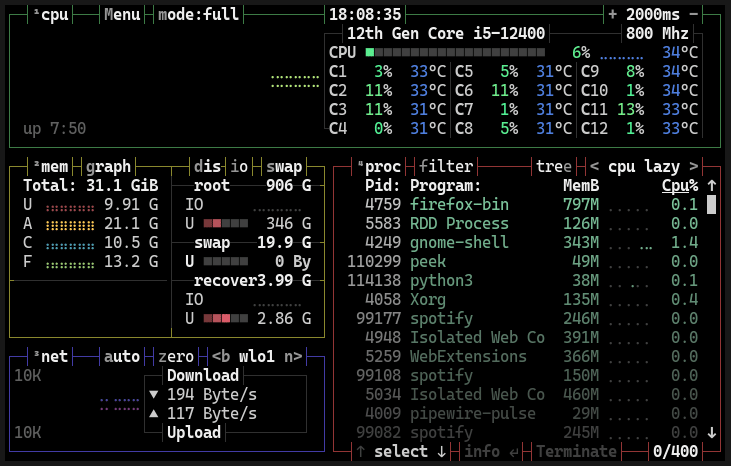
The bashtop utility is built to show you selected information in the most detailed and simplest manner possible.
Along with full mouse support, you get process filters, a menu for configuration and even custom presets for your use.
Eventually, you get a modern-looking system monitor that has various features to
The easiest way to install bashtop is to install it via snap:
snap install bashtopBut if you hate using Snaps, you can visit their GitHub and read instructions to build it from the source.
4. btop
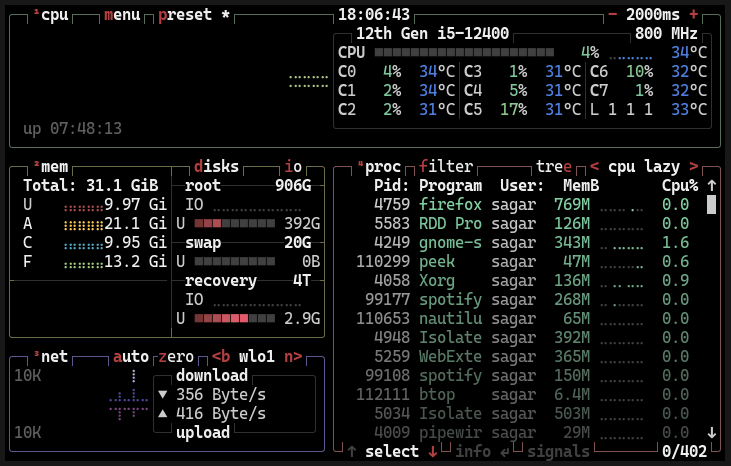
If you notice, it resembles the interface of the bashtop as it is a C++ version of bashtop. But it has some distinctive features such as support for GPU monitoring.
Sure, you get all the basic features that you'd expect from any modern system resource monitor, such as mouse support, CPU temperatures, disk utilization, etc.
Also, there are various customization options built-in to it, so you can make it look and work as per your needs.
If you're on Fedora, it can be installed directly with the following command:
sudo dnf install btopSadly, it is not for Ubuntu or Arch so getting a snap package makes sense in that (if you want easy installation):
sudo snap install bashtop5. vtop
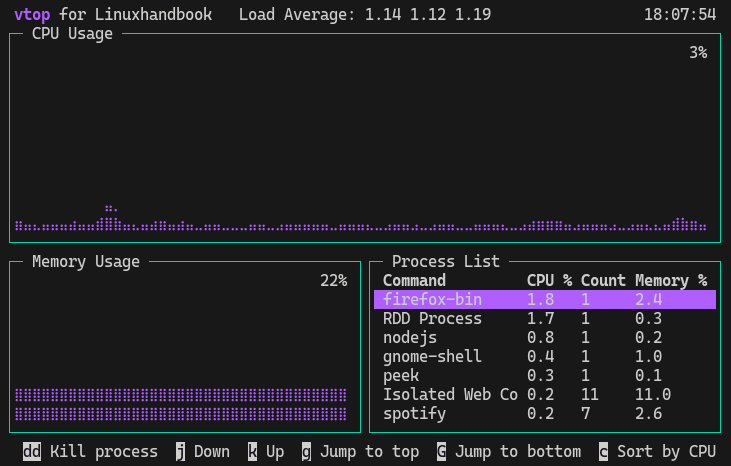
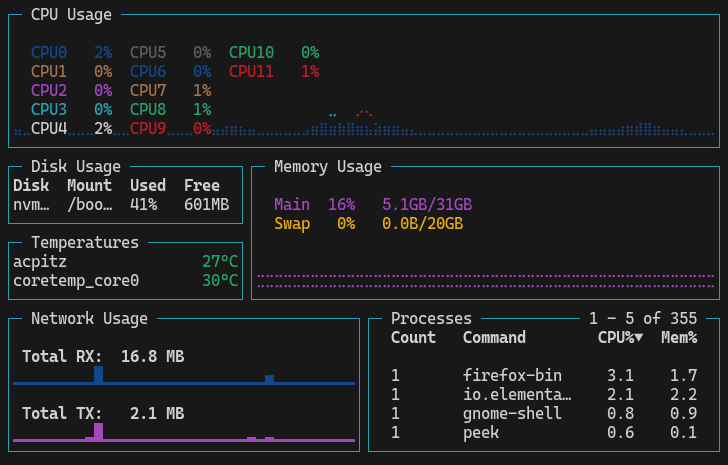
Unlike other utilities from the list, vtop tries to be a simple, clean, and visually appealing system monitor that does its job quite well.
It is simple.
Shows CPU and memory usage and gets you a process list sorted based on memory consumption from where you can also kill processes.
In simple terms, it has everything that any beginner or even an intermediate user would want to have.
While writing, it is only available as an npm package and can be installed using the following command:
sudo npm install -g vtop6. byptop
Looks similar to bashtop? Well, it is bashtop written in Python that has a similar set of features so you get everything that bashtop has but in Python.
It has an easy-to-use game-inspired menu, full mouse support, process filtering, and an auto-scaling graph for network usage.
But unlike bashtop, byptop is available in the repository of almost every popular Linux distribution so installation is a plus point.
To install it in Ubuntu/Debian:
sudo apt install bpytopFor Arch Linux:
sudo pacman -S bpytopFor Fedora base:
sudo dnf install bpytopUsing Pip:
pip3 install bpytop --upgrade7. atop
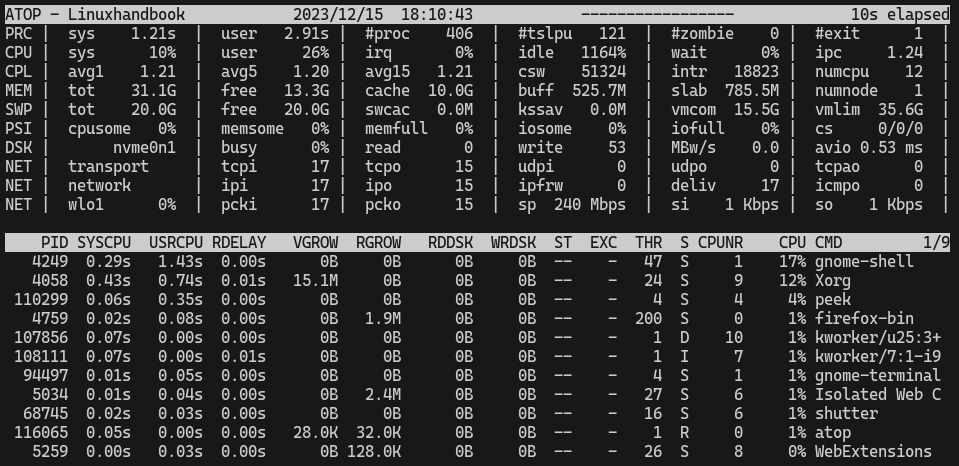
This is quite different from the other tools on the list and initially, it looked a little outdated to me, until I realized how good this utility is.
What I loved about this utility is it highlights critical resources using the red color for easy identification to let you know what is taking up a large chunk of resources without any additional sorting.
The other unique feature of Atop is long-term analysis as it will quietly stay active in the background (default is 28 days) to let you know the long-term system analysis.
The installation is also quite simple as it is available in the default repository of most Linux distributions.
For Ubuntu/Debian:
sudo apt install atopFor Fedora:
sudo dnf install atopFor Arch Linux:
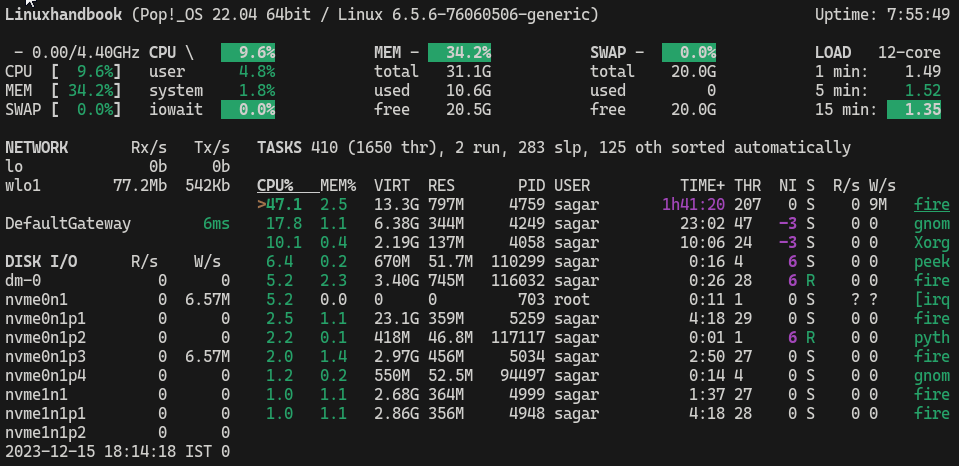
sudo pacman -S atop8. bottom
The bottom utility has a unique way of presenting system data where each section is divided with enough space and gives you enough data by default that most users wouldn't need for further customization.
Unlike most options, it has a separate section of temperatures where it shows the temperature of your system which is a must while monitoring your system.
You can also use the focus mode to just monitor one widget such as CPU monitoring or Processes.
Sadly, to install the bottom on Ubuntu or Debian, you have to use the .deb file or snaps. To use the .deb file, first, use the curl command to download it:
curl -LO https://github.com/ClementTsang/bottom/releases/download/0.9.6/bottom_0.9.6_amd64.debThen, you can install the deb files in Ubuntu using the dpkg command:
sudo dpkg -i bottom_0.9.6_amd64.debIf you want to use snaps, here's how you get there:
sudo snap install bottomFor Fedora/Alma/Rocky Linux:
sudo dnf copr enable atim/bottom -y
sudo dnf install bottom
9. gotop
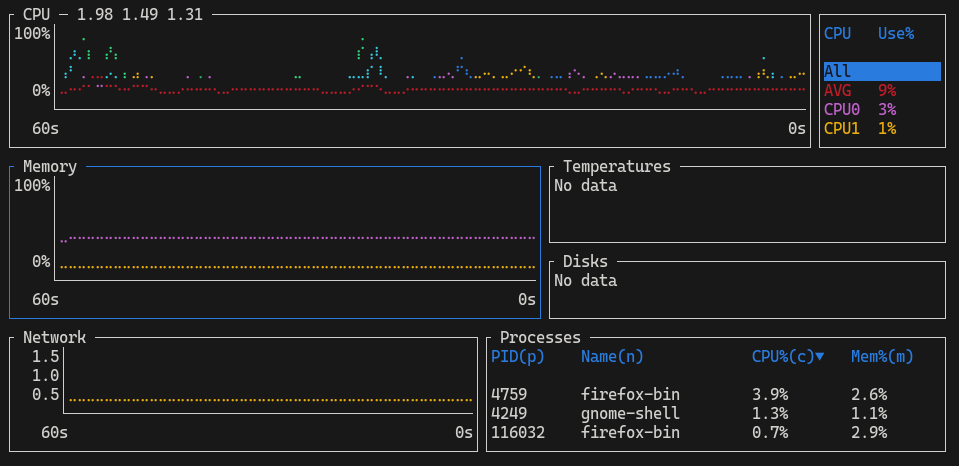
"Super clean" was my expression after looking at the gotop as even after giving you so much information, it does not look bloated.
As the name suggests, it is a system monitor utility written in GO and has small details like each code is presented with a different color, and in the process graph, it will use the same color showing which core is being utilized.
In simple terms, a very functional system monitor that is appealing to the eyes.
However, the installation requires a few extra steps as it is not available in the default repository of most distros.
The easiest way to get the latest version is to use the homebrew package manager:
brew install gotopYou can also use prebuilt binaries from their GitHub and directly install gotop using deb and rpm packages
10. Glances
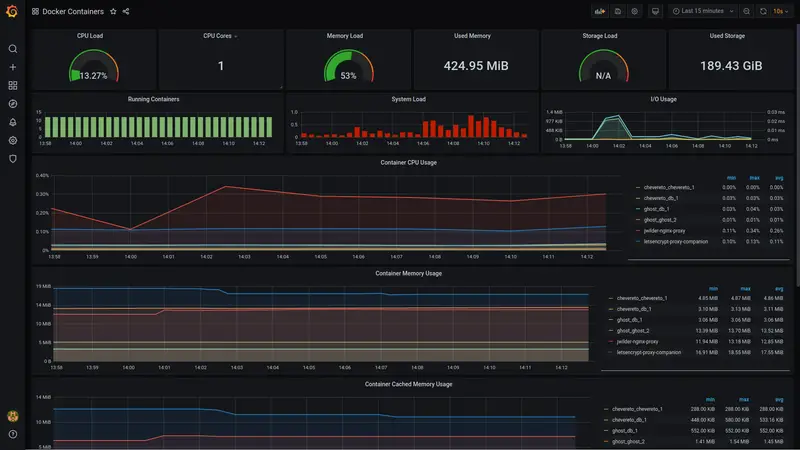
Glances is one of very few system monitoring utilities that lets you monitor your containers and information can also be accessed via web interface.
So it is a very feature-rich utility and is equipped with all the necessary features that any advanced user would need to monitor the system.
Lacking what you were expecting it to be? You can use modules to extend its features.
The easiest way to get hands-on with the glances is to use the homebrew:
brew install glancesBut if you insist on getting it without homebrew then you'd have to build it from the source.
11. nmon
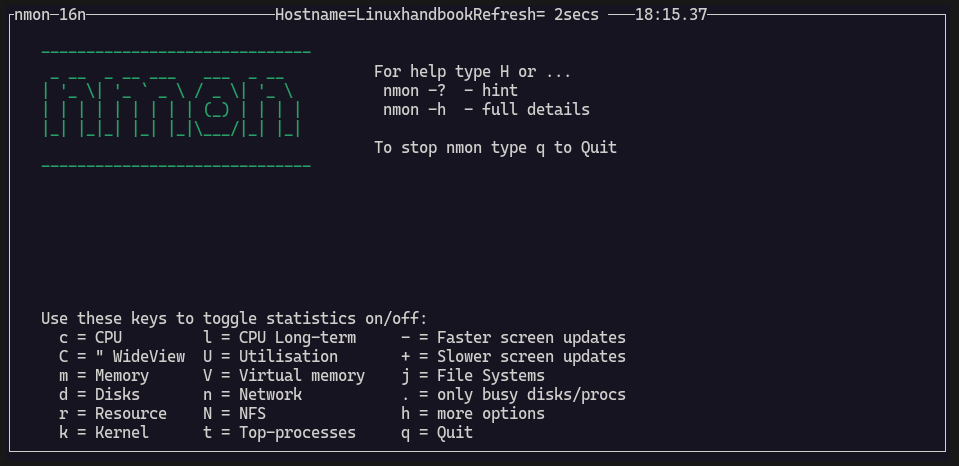
Unlike the other system monitors in the list, nmon is the most user-interactive utility where you're asked to choose what you want to monitor.
Why? To get you the most detailed output for the chosen option.
Apart from the basic monitoring, it gets you kernel and load average, long-term CPU utilization, and a bunch of other options to play with.
The installation is also quite simple as it is available in the default repository of most Linux distributions.
For Ubuntu/Debian base:
sudo apt install nmonFor Fedora/RHEL:
sudo dnf install nmonFor Arch Linux:
sudo pacman -S nmonHere's how to monitor Docker containers
Want to monitor Docker containers? We wrote a detailed guide explaining how you can monitor Docker containers:
I hope you'll find the best resource monitoring package through this guide.