top Command Examples
The top command provides a quick look at system resources and processes. You can also control it to use it as the task manager in Linux terminal.


The top command offers a quick overview of system information. It reports data about current processes which is refreshed (by default) every 3 seconds.
Using and understanding a program like top is an essential system administration skill. In this article, I will explain teach you how to navigate top command with confidence.
Understanding top command in Linux
topTop is straight-forward to use. This simple command will bring you into the top application. When you want to exit, type the letter q to quit. There are also other key commands to make full use of it that I’ll discuss later.
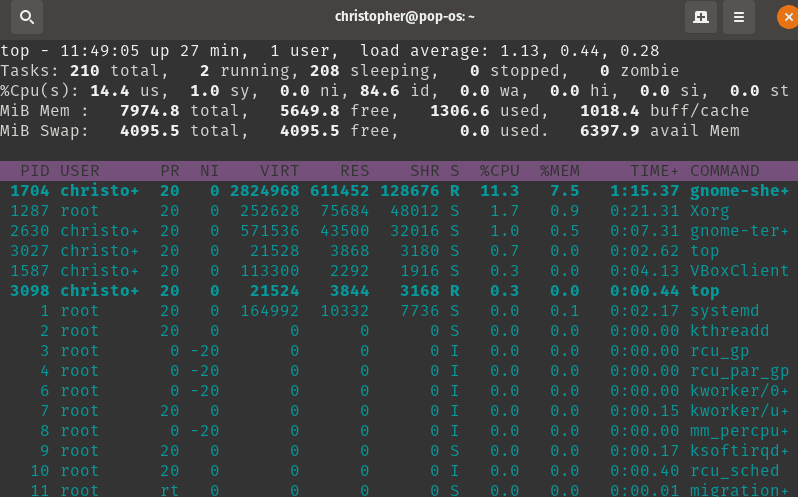
You can easily check CPU load, the number of current tasks, as well as viewing information about memory usage. You’ll notice that while running there are essentially 2 sections with information.
At the top of our terminal, we get our overview data including memory usage and cpu load. Below that, we have a table with specific processes with plenty of details.
There is a lot of detailed information displayed in a condensed format. Let’s break it into smaller pieces so that we have a more complete understanding. The first four lines contain the overview data I mentioned before. Let’s take them line by line and explain what’s going on.
User Info, Uptime, and Load Averages
top - 11:49:05 up 27 min, 1 user, load average: 1.13, 0.44, 0.28The first piece of information is a timestamp, which is pretty self-explanatory. Next to it you will see the system up time. In my case, it reads 24 mins. This refers to how long the computer has been running without interruption. Next we see three values for the load average. These figures are readings over 1 minute, 5 minutes, and 15 minutes, in that respective order.
For our purposes load values can be understood as an estimate of the “stress” on your system’s processing power. For example, a load of 1.0 would mean that 100% of your processing power is currently at work.
Tasks
Tasks: 210 total, 2 running, 208 sleeping, 0 stopped, 0 zombieSystem processes are also known as tasks. An operating system relies on a number of processes running in the background to make other activities possible, such as using a web browser.
Processes can be run in many different ways and are prioritized using a variety of algorithms. This serves to optimize how and when the computer performs the task. This is intended as a high-level overview so we will keep it simple here. We want our readers to know that there is more to computing than the states described here.
That said, let’s look at what each of these means:
| State | Description |
|---|---|
| Running | Active / in Queue to be Processed |
| Sleeping | Waiting for a Process to Complete |
| Stopped | Interrupted by Job Control Signal (CTRL+C, for example) |
| Zombie | Made up of “Orphaned” Child Tasks / No Longer Running |
CPU information in top command
%Cpu(s):100.0 us, 0.0 sy, 0.0 ni, 0.0 id, 0.0 wa, 0.0 hi, 0.0 si, 0.0 stEach of the values here is a percentage of time spent on the respective tasks. The table below explains what is meant by each abbreviation. This gives a fairly detailed breakdown of how processing power is being used.
| Abbreviation | Description |
|---|---|
| us | Processing done in User Mode |
| sy | Processing done in System/Kernel Mode |
| ni | Time Spent on “Nice” Processes |
| id | Time Spent Idle |
| wa | Waiting for a I/O Process to Complete |
| hi | Time Spent Due to Hardware Interrupts |
| si | Time Spent Due to Software Interrupts |
| st | Time “Stolen” by Virtual Machine Resources |
Memory usage in top command
MiB Mem :   7974.7 total,   5974.0 free,   1046.9 used,    953.9 buff/cache
MiB Swap:   4095.5 total,   4095.5 free,      0.0 used.   6660.1 avail Mem
These lines mimic the output of the free command in Linux.
Task Table
This is really the heart of the top command. If you came from windows, you’re probably familiar with using CTRL+ALT+DEL to access Task Manager. This is sort of a more “stripped” down version of that. You see the table of all the currently running tasks.
Here is a sample of some tasks displayed in top.
PID USER      PR  NI    VIRT    RES    SHR S  %CPU  %MEM     TIME+ COMMAND
1703 christo+  20   0 2338396 342200 114744 S   7.9   4.2   0:25.05 gnome-shell
1285 root      20   0  237252  72360  46012 S   4.3   0.9   0:04.00 Xorg
2158 christo+  20   0  496976  42952  32192 S   4.0   0.5   0:01.74 gnome-terminal-
2703 christo+  20   0   21528   3880   3204 R   0.7   0.0   0:00.40 top
Here is a table to help make sense of the column header abbreviations.
| Abbreviation | Description |
|---|---|
| PID | Process ID (Unique Positive Integer) |
| USER | User Name |
| PR | Priority (Kernel) |
| NI | Nice Value |
| VIRT | Virtual Memory |
| RES | Resident Size (Physical Memory) |
| SHR | Shared Memory |
| S | Process Status (Running, Stopped, etc.) |
| %CPU | CPU Load |
| %MEM | Percentage of RES / Total RAM |
| TIME + | Total Time Spent on Process |
| COMMAND | Command That Began Process |
These are the default fields on my distribution. Your system may be slightly different. These are customizable by typing F while top is running. This will display a complete list of available options
Customizing and interacting with the top command output
Once you have your display set up in a way that you like. It’s time to get some work done. Let’s take a look at the full list of options for top (accessible by typing h) and look at some examples.
1. Color and Memory Scale
Z,B,E,e Global: 'Z' colors; 'B' bold; 'E'/'e' summary/task memory scaleWe have covered the color changes, but you can also modify the memory scale from bytes all the way up to petabytes. E modifies the figures from the summary section, while a e adjusts the scale in the task table.
2. Toggle Views for Summary Info
l,t,m Toggle Summary: 'l' load avg; 't' task/cpu stats; 'm' memory infoEach respective key will adjust the display options. The default is a text based output, but there are also simulated bars or you can turn items off completely.
3. View CPU-Specific Info
0,1,2,3,I Toggle: '0' zeros; '1/2/3' cpus or numa node views; 'I' Irix modeI only have one CPU on my virtual machine, but you can see how it would work if there were multiples. You can separate into individual nodes with their own statistics.
4 Top Field Manipulation
f,F,X Fields: 'f'/'F' add/remove/order/sort; 'X' increase fixed-widthWe can add or remove any fields we want displayed, we can also adjust the fixed-width of the text.
Similarly, you can also sort top command output.
5. Locate String
L,&,<,> . Locate: 'L'/'&' find/again; Move sort column: '<'/'>' left/right6. Organize Your View
R,H,V,J . Toggle: 'R' Sort; 'H' Threads; 'V' Forest view; 'J' Num justifyThese commands give you options for organizing task information. Sort will display all of the tasks by PID, rather than the default sort by activity function. Threads will change your detailed and summary view to thread-oriented instead of task-oriented. Forest view arranges processes in a ‘tree’ structure to demonstrate parent-child relationships. Numeric justify changes the default left-aligned position of numeric fields.
7. Toggle Full-Path, Idle Tasks, Cumulative Time, and Text Justification

c,i,S,j . Toggle: 'c' Cmd name/line; 'i' Idle; 'S' Time; 'j' Str justifyWhen you toggle c, you will see the full path of commands. Idle removes all non-active tasks from the display. S uses cumulative time. String justify changes the default left-aligned position of string fields.
8. Toggle Highlights
x,y . Toggle highlights: 'x' sort field; 'y' running tasksUsing x to toggle sort field and y to sort running tasks.
9. Filter by User or Field/Value
u,U,o,O . Filter by: 'u'/'U' effective/any user; 'o'/'O' other criteriaWe can easily filter out specific users or field/values. This is great for a system with many users or a lot of open tasks. Filters require a comparison operator between the field and the value. As you can see here I typed COMMAND=top to filter all commands except for top. Using shift with either command toggles case-sensitivity.
10. Filter number of Processes
n,#,^O . Set: 'n'/'#' max tasks displayed; Show: Ctrl+'O' other filter(s)Using either n or # will give you the option to enter a numeric value. This will show only the number of processes desired.
11. Renice or Kill Process with PID in top command
k,r Manipulate tasks: 'k' kill; 'r' reniceUsing these commands, we can change the nice value or kill the process. I filtered out the specific PID to make it easier to see. I changed the nice value to 20. Then I sent a kill command. Using kill by default sends a SIGTERM signal. This allows it to finish executing code before terminating.
12. Change the default update time in top command
d or s Set update intervalHere, I have changed the default update time from every 3.0 seconds, to every 1 second. You can adjust any time that suits your needs. It’s possible to use d or s to perform the same operation.
Conclusion
The top command shows the stats in real time. If you want to check the system resource usage historical data, you are better off with commands like sar or some other tool.
Did you enjoy our guide to top? I hope these tips taught you something new about working with top. If you like this guide, please share it on social media.
If you have any comments or questions, leave them below. If you have any suggestions, for topics you’d like to see covered, feel free to leave those as well. Thanks for reading.
About the author
 Christopher Murray
Christopher works as a Software Developer in Orlando, FL. He loves open source, Taco Bell, and a Chi-weenie named Max.