Use tcpdump to Monitor HTTP Traffic and Extract Sensitive Data like Password and Cookies
A hands-on tutorial you can follow to analyze http traffic for sensitive data such as cookies and passwords.


You already know the basics of tcpdump from our guide. It helps you watch live traffic, spot misconfigurations, and check that sensitive data is handled safely.
Let’s put tcpdump to some practical work. The skills you practice here also align with objectives in CompTIA Security+ or network security roles.
In this hands-on tutorial, we’ll run examples against the test site http://testphp.vulnweb.com to filter GET, POST, and sensitive data.
By focusing on high-value traffic, security engineers can efficiently audit network flows and identify potential risks without being overwhelmed by irrelevant packets.
1. Observing Network Behaviour
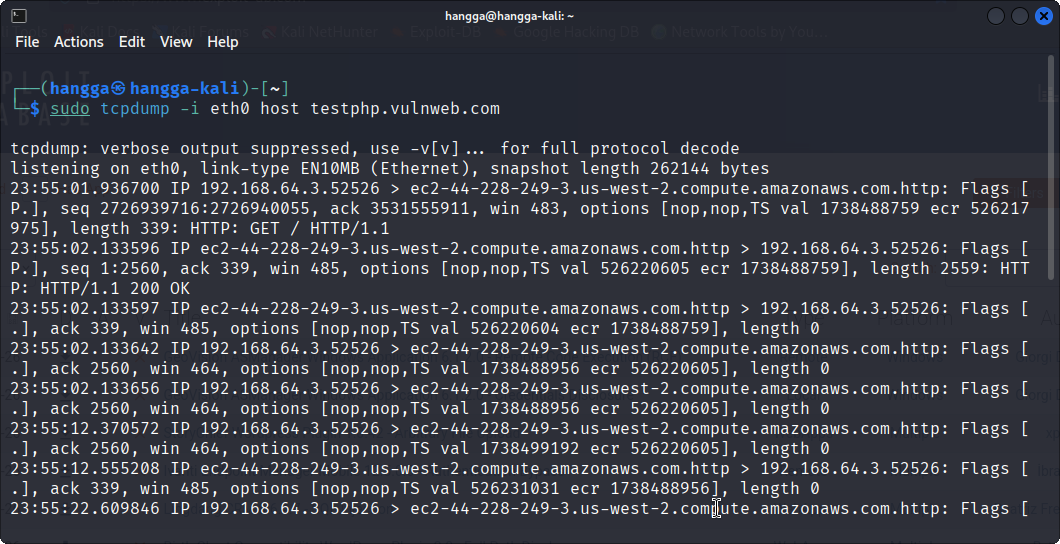
sudo tcpdump -i eth0 host testphp.vulnweb.com
This captures traffic to and from testphp.vulnweb.com.
Key observations you should focus on as a security engineer:
- Identify backend infrastructure and exposed IPs
- Check if sensitive data is transmitted in plaintext
- Monitor response size and timing to detect anomalies
- Ensure connection health is stable (ACKs, retransmits)
From the output above, let's zoom in on this part:
23:55:01.936700 IP 192.168.64.3.52526 > ec2-44-228-249-3.us-west-2.compute.amazonaws.com.http:
Flags [P.], length 339: HTTP: GET / HTTP/1.1

23:55:02.133596 IP ec2-44-228-249-3.us-west-2.compute.amazonaws.com.http >
192.168.64.3.52526:
Flags [P.], length 2559: HTTP: HTTP/1.1 200 OK

Flags [.], ack ..., length 0
Breaking it down:
| Line / Field | What It Shows |
|---|---|
192.168.64.3.52526 > ec2-... |
Your local machine (source port 52526) talking to AWS EC2 host on port 80 (HTTP). |
Flags [P.] length 339 |
PSH + ACK = this packet contains data, the HTTP GET request. |
ec2-... > 192.168.64.3.52526 |
The server’s response back to you on the same TCP session. |
length 2559: HTTP/1.1 200 OK |
2.5 KB payload from server, confirms 200 OK response. |
Flags [.], ack ..., length 0 |
Plain ACK packets, no payload, normal TCP housekeeping. |
2. Filter at the TCP Payload Level
Before you use TCP Payload Level, you should first understand TCP Header.
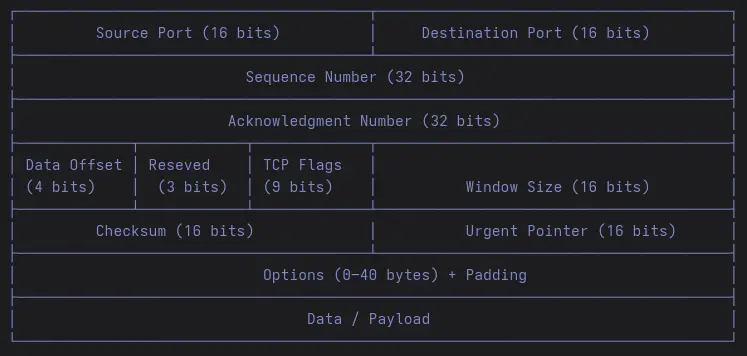
Each TCP segment has a header that contains the information needed for reliable transmission.
| Field | Offset (bytes) | Size (bytes) | Size (bits) | Purpose / Description |
|---|---|---|---|---|
| Source Port | 0–1 | 2 bytes | 16 bits | Port number of the sending process on the source host |
| Destination Port | 2–3 | 2 bytes | 16 bits | Port number of the receiving process on the destination host |
| Sequence Number | 4-7 | 4 bytes | 32 bits | Indicates the order of bytes sent; required for reliable delivery |
| Acknowledgment Number | 8-11 | 4 bytes | 32 bits | Confirms which bytes have been received |
| Data Offset | 12 (bits 0–3) | — | 4 bits | Shows where the header ends and the payload begins |
| Reserved | 12 (bits 4–6) | — | 3 bits | Reserved for future use; normally zero |
| TCP Flags (NS,CWR,ECE,URG,ACK,PSH,RST,SYN,FIN) | 12–13 (bits 7–15) | — | 9 bits | TCP control bits managing the TCP state machine |
| Window Size | 14–15 | 2 bytes | 16 bits | Flow control: how much data the receiver can accept |
| Checksum | 16–17 | 2 bytes | 16 bits | Integrity check over header and payload |
| Urgent Pointer | 18–19 | 2 bytes | 16 bits | Marks urgent data; rarely used today |
| Options (if present) | 20–59 | 0–40 bytes | 0–320 bits | Optional parameters; extend header beyond the minimum 20 bytes |
Let's take a look at this filter:
tcp[((tcp[12:1] & 0xf0) >> 2):4]
This extracts the first four bytes of the payload based on the Data Offset, which is key for monitoring GET/POST requests safely.
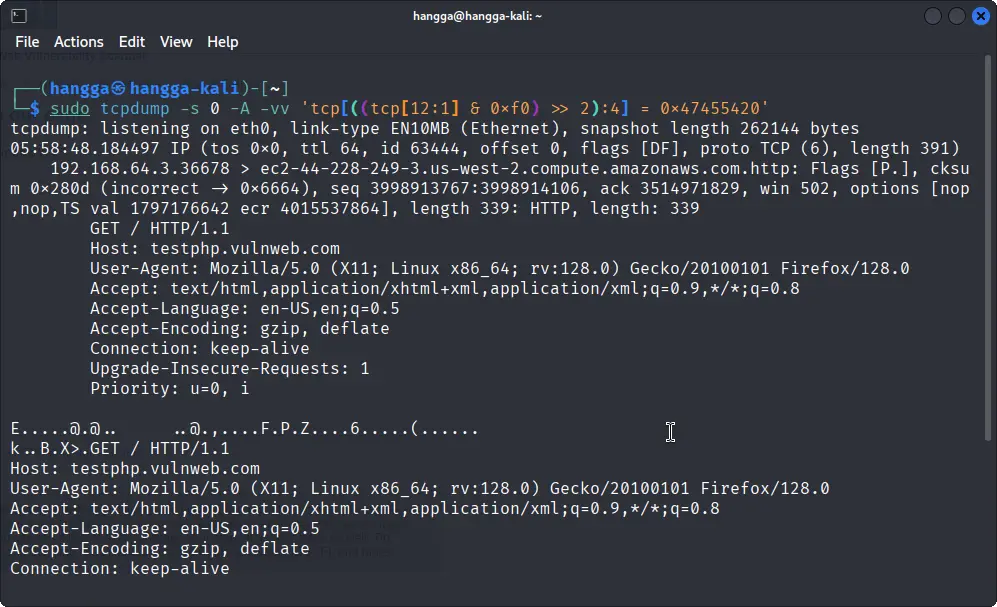
Capturing HTTP GET Requests
The command below selects packets whose payload starts with 0x47455420, which is the hexadecimal code for 'GET'.
sudo tcpdump -s 0 -A -vv 'tcp[((tcp[12:1] & 0xf0) >> 2):4] = 0x47455420'
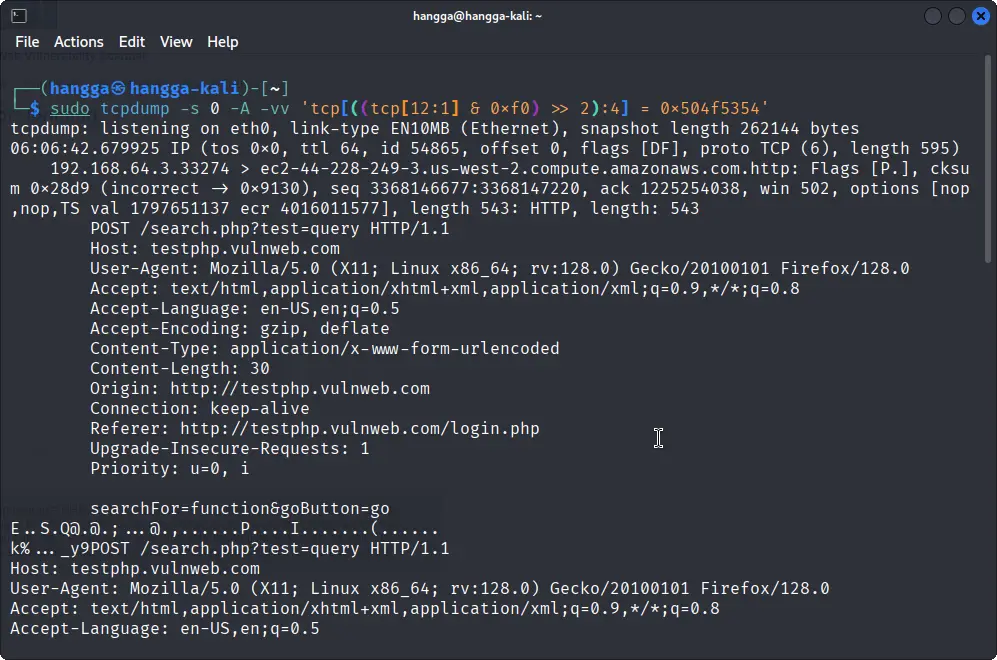
Capturing HTTP POST Requests
The command below matches packets whose payload begins with 0x504f5354, the hex for 'POST'.
sudo tcpdump -s 0 -A -vv 'tcp[((tcp[12:1] & 0xf0) >> 2):4] = 0x504f5354'
3. Using grep and egrep to get password and cookies
You can use egrep to search for text using patterns. Unlike grep, egrep supports extended regular expressions, so you can match multiple patterns at once using symbols like | (OR) or () for grouping.
egrep to quickly filter output for lines that match any of your patterns, e.g., certain HTTP methods, headers, or parameter names.Monitoring Sensitive POST Data
sudo tcpdump -s 0 -A -n -l | egrep -i "POST /|pwd=|passwd=|pass=|password=|Host:"
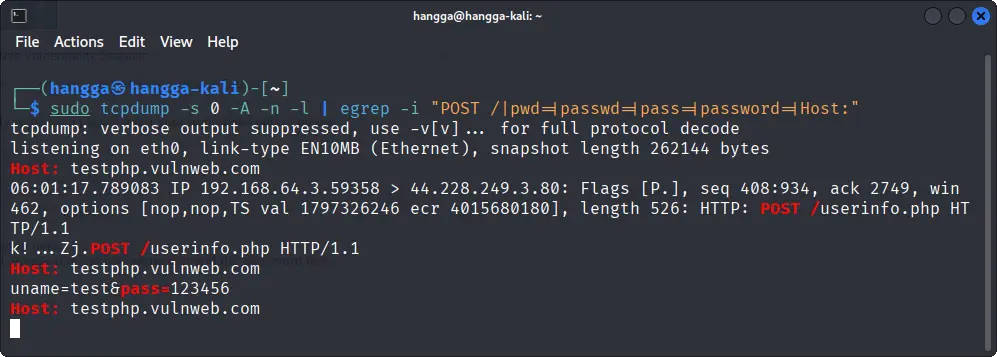
Use this command only in controlled lab environments or on traffic you are authorized to monitor. Regularly verify that credentials are never transmitted over HTTP.
Observing HTTP Cookies
sudo tcpdump -nn -A -s0 -l | egrep -i 'Set-Cookie|Host:|Cookie:'
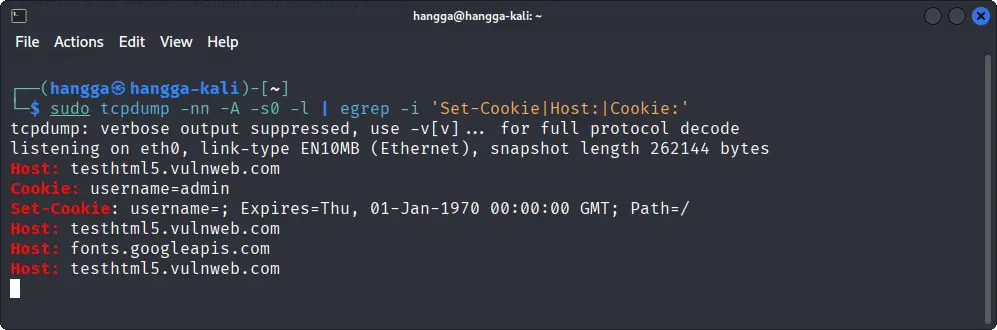
This is useful for:
- Inspect session IDs and cookies for secure transmission.
- Ensure
SecureandHttpOnlyflags are used.
Use this to audit cookie security and session handling policies. Never capture cookies from unauthorized users.
Extracting HTTP User-Agents
In this one, we only match one pattern, so just use grep:
sudo tcpdump -nn -A -s1500 -l | grep "User-Agent:"
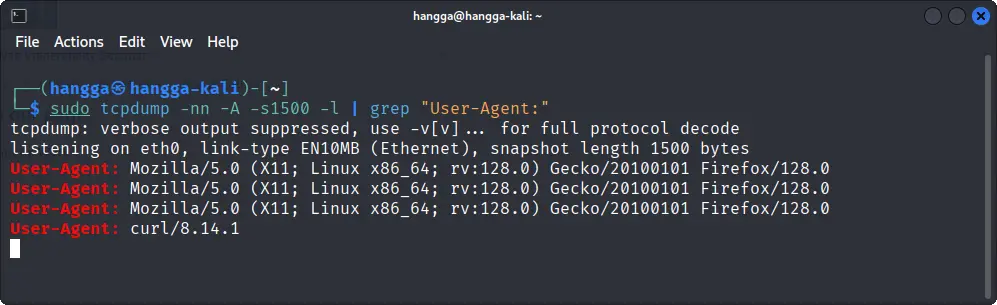
Helpful for:
- Identify which clients or automated tools interact with your service.
- Spot misconfigured scanners or unauthorized bots.
Use this for traffic profiling and anomaly detection. Helps enforce internal security policies.
Conclusion
tcpdump is a lightweight yet powerful monitoring tool for security engineers. It lets you monitor data securely, spot anomalies, and see network activity without disrupting operations.
Integrate tcpdump monitoring into SOC workflows or automated scripts to catch potential issues in real time. Always operate within authorized boundaries.
About the author
Software engineer since 2008, passionate about tech and security. Seasonal security researcher and pentester who enjoys sharing knowledge.