
Tcpdump is a great tool for analyzing networks and hunting down associated network problems. It captures packets as they go by and shows you what’s going on and coming in on your network. The output from the command displays on the STDOUT and can also be stored in a file.
Thanks to the developers, who have kept the Tcpdump as an open source project. It is freely available on Unix and Linux systems. Windows has a ‘Microolap TCPDUMP for Windows’ variant with an associated price tag.
tcpdump has a long list of options available for use. In this article, I'll focus on core options that are frequently used.
1. Checking the Available Interfaces
To check all the available interfaces to capture on, use the ‘-D’ flag as:
sudo tcpdump -DThis will list all the interfaces on the system including wireless and wired interfaces and others. The same functionality can also be gained with the --list-interfaces flag:
sudo tcpdump --list-interfaces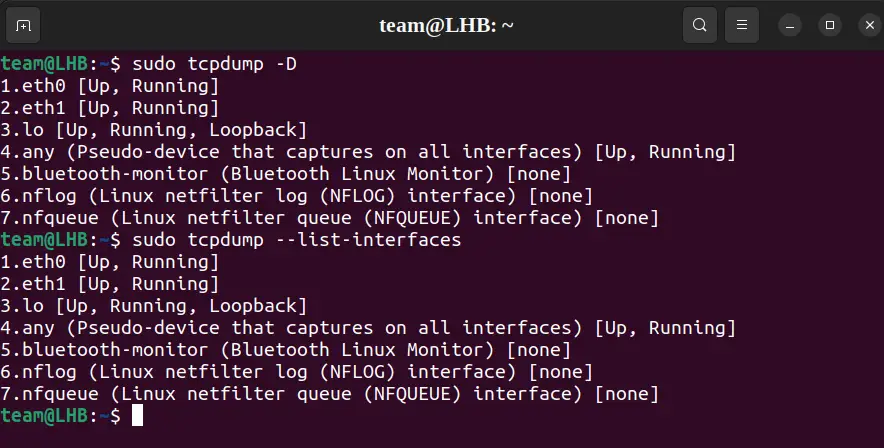
2. Capturing Packets for a Specific interface
Without using any option, Tcpdump will scan all the interfaces. The -i flag captures traffic from a specific interface:
tcpdump -i <target-interface>Replace the target-interface with the name of the interface you want to scan. For example, in the case of the interface eth0, this command will be as:
sudo tcpdump -i eth0Note: From now on, I'll use the eth0 or eth1 as the target interface. So wherever you see the -i flag, it will be accompanied by either the interface eth0 or eth1.
3. Presetting Capture Count
The -c flag can be used to preset the number of packets to be captured.
As an example, let’s set this value to 4 for capturing four packets. The command, in this case, will be:
sudo tcpdump -c 4 -i eth0 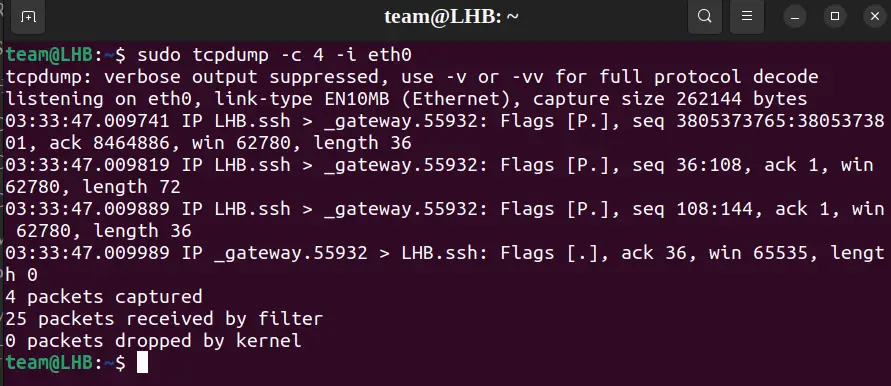
If you do not specify a count, the capture operation is to be manually interrupted using the key combination ctrl+c or ctrl+z.
In the following article, I'll add the -c flag with other flags wherever required. This will help us to clearly and easily understand the output of a command.


4. Getting a Verbose Output
For getting a verbose output of a tcpdump command, you can use the -v flag:
sudo tcpdump -c 6 -v -i eth0 You can further increase the level of verbosity using more -v flags as -vv or -vvv. This will yield more detailed output on the terminal:
sudo tcpdump -vv -i eth0 5. Printing the Captured Data in ASCII Format
Sometimes we may require the Tcpdump output to be in HEX or ASCII format. We can work out this using the options -A for ASCII format and -XX for both ASCII and HEX format:
sudo tcpdump -XX -i eth0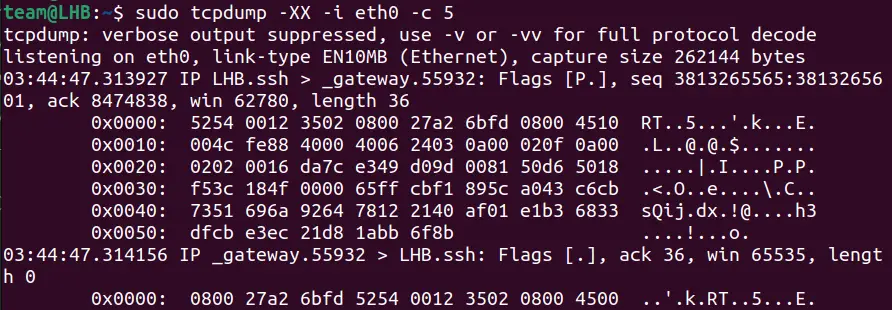
6. Capturing Packets Sent From a Specific Source IP
In case you want to inspect the traffic coming from a specific source IP address, use this command:
sudo tcpdump -i eth0 src <source-ip-address>Let’s take the source IP as 192.168.56.11 and see the details of the traffic:
sudo tcpdump -i eth1 -c 5 src 192.168.56.11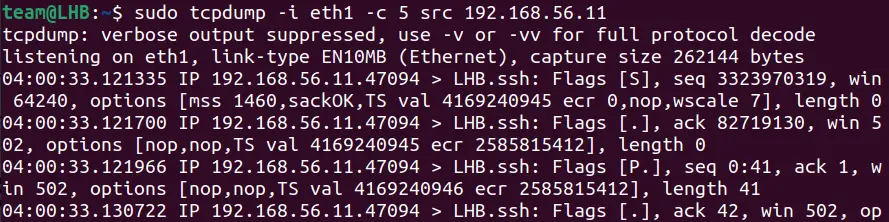
The count 5 here will capture only the first five packets.

7. Capturing Packets Sent to a Specific Destination IP
In case you want to inspect the traffic sent to a specific destination IP address, use the command:
sudo tcpdump -i eth0 dst <source-ip-address>Let’s take the destination IP as 192.168.56.11 and see the details of the traffic:
sudo tcpdump -i eth1 -c 5 dst 192.168.56.11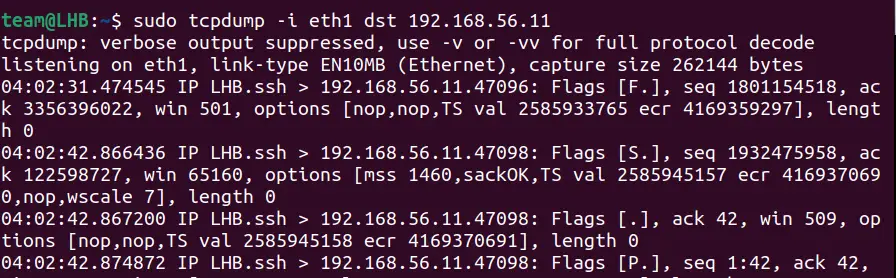
8. Using Filtering Options with Tcpdump
It's a good approach to narrow down your captured data for inspection. This will eliminate unnecessary traffic and simplify your job. You can do this by filtering the traffic based on host, ports, protocols, and other criteria.
Let’s see some of them:
Port number
In case you want to filter traffic based on port number, say port 22, then execute the tcpdump command as:
sudo tcpdump -i eth0 port 22This command will capture both the TCP and UDP traffic.
Protocol
Similar to the port directive, the proto directive filters the packet capture based on particular traffic. Here, you can either use the protocol name or the protocol number as the argument value:
sudo tcpdump -i eth0 proto tcpsudo tcpdump -i eth0 proto 6To your surprise, the two commands above are equivalent. It is because 6 is the protocol number for TCP.
Host Filter
The host argument simply filters the traffic from a specific host using its IP:
sudo tcpdump -i eth0 host 192.168.56.10This will capture all the traffic and out from this host. Interestingly, you can apply multiple filters to your host to target a specific type of packet traffic.
For example:
sudo tcpdump -i eth1 -c 50 “(host 192.168.56.11) and (port 443 or port 80)"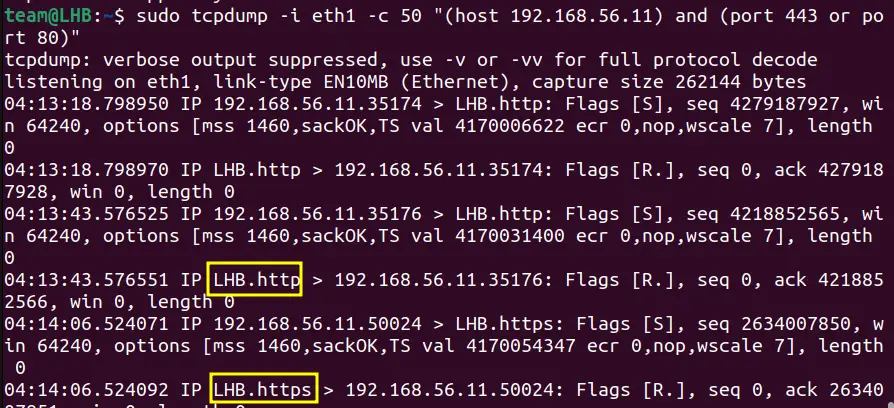
Here, I have merged different filter rules into a single rule. You can see this rule is filtering http and https traffic. This is because the rule contains the filter for ports 80 and 443, the common networking ports.
9. Saving the Captured Data
If you want to store the captured data in a file, you can do it like this.
sudo tcpdump -i eth0 -c 10 -w my_capture.pcap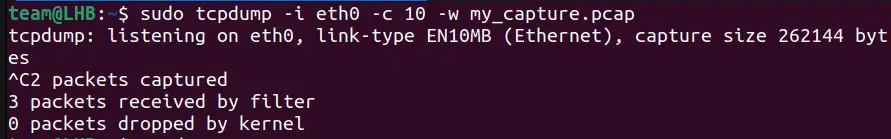
Keep the packet count to a smaller value; otherwise, you may have to stop the process manually.
10. Reading the Captured Data
You can use the data stored in the .pcap file for analysis with Wireshark or any other graphical network protocol analyzer.
You can read it with tcpdump itself.
tcpdump -r my_capture.pcap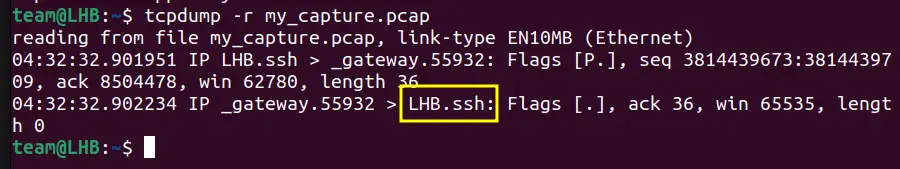
The above screenshot shows the data of the above my_capture.pcap file.
Conclusion
That’s all for now. I hope you have a good idea of how to use different ways to work with tcpdump command. It is the best option when you are capturing packets from a remote headless machine.
If you want a more visual way to understand packet capture, try Wireshark.