

Monitoring is one of the essential activities in the DevOps world. and I don't even need to convince you about why monitoring is a good idea. You already know that, right?
You may of course stick to command line tools to monitor your server and the docker containers running on it, a GUI-based approach adds the convenience of analyzing performance metrics with an intuitive experience to observe multiple parameters all at once on the screen It also makes it easier for sharing the monitoring dashboard with less technical people.
In this tutorial, I am going to show you how you can set up monitoring for docker containers with dockprom and present it in a visually appealing form thanks to Grafana.
Monitoring docker host and containers with Dockprom
Dockprom is one such stack that runs diverse monitoring tools as a collective toolset for your server monitoring needs.
 stefanprodan
Do keep in mind that the exmaple here is going to be based on Nginx reverse proxy configuration. The official Dockprom configuration is based on Caddy.
At Linux Handbook and High On Cloud, we use Nginx in standard practice. So, I redesigned the Dockprom configuration to be based on Nginx instead of Caddy. The result looks very simplistic like our previous Nginx deployments.
Essentials for Dockprom setup
Dockprom utilizes the following tools for providing monitoring solution for your Docker host and containers.
Grafana
Grafana allows you to query, visualize and alert on metrics and logs no matter where they are stored. This is going to be the primary and only web frontend through which you will be utilizing all the remaining backend applications shared in the remaining tools' sections.
Therefore, this is where you need to add the popular Nginx based environment variables that you have been using all through for accessing our applications from anywhere on the web:
environment:
  - VIRTUAL_HOST=dockprom.domain.com
  - LETSENCRYPT_HOST=dockprom.domain.com
Make sure you change this according to your domain or subdomain.
Prometheus
Prometheus is an open-source systems monitoring and alerting toolkit used by thousands worldwide.
Pushgateway
The Pushgateway is an intermediary service which allows you to push metrics from jobs which cannot be scraped. You might want to read this to really know whether you actually need it. This is because there are limited cases where it would be necessary.
Alertmanager
The Alertmanager handles alerts sent by client applications such as the Prometheus server. It takes care of deduplicating, grouping, and routing them to the correct receiver integration such as email, PagerDuty, or OpsGenie. It also takes care of silencing and inhibition of alerts.
cAdvisor
cAdvisor is an open source tool from Google that provides container users an understanding of the resource usage and performance characteristics of their running containers.
In this particular configuration, I was facing an issue about fetching two metrics based on two respective errors after deploying the official cAdvisor config stated in the Dockprom Stack:
Failed to get system UUID: open /etc/machine-id: no such file or directory
Could not configure a source for OOM detection, disabling OOM events: open /dev/kmsg: no such file or directory
I looked up the official cAdvisor repository where solutions had been provided. The first one worked but the second was not quite what I was looking for, since this solution was based on a docker run based launch command.
A Docker Compose fix was needed. I first tried to mount /dev/kmsg but that wasn't going to do the job. Finally, based on the docker run based solution, I found that on similar lines, Docker Compose provides a separate flag called devices that can be used to mount /dev/kmsg as a device. You can read about it here.
So, the fix for the first issue was to add the following to lines in the volumes section:
	volumes:
  	  ---
      ---
      - /etc/machine-id:/etc/machine-id:ro
      - /var/lib/dbus/machine-id:/var/lib/dbus/machine-id:ro
The second one is as just discussed:
    devices:
      - /dev/kmsg:/dev/kmsg
Note how such metrics are important for mounting from the host since it is the host you want to monitor through Docker.
Node Exporter
The Prometheus Node Exporter exposes a wide variety of hardware- and kernel-related metrics. It's similar to how metrics are exposed in cAdvisor.
Clubbing up all the above, your complete Docker Compose file is going to look like this:
version: '3.7'

networks:
  net:
    external: true

volumes:
    prometheus_data: {}
    grafana_data: {}

services:

  prometheus:
    image: prom/prometheus:v2.24.0
    container_name: prometheus
    volumes:
      - ./prometheus:/etc/prometheus
      - prometheus_data:/prometheus
    command:
      - '--config.file=/etc/prometheus/prometheus.yml'
      - '--storage.tsdb.path=/prometheus'
      - '--web.console.libraries=/etc/prometheus/console_libraries'
      - '--web.console.templates=/etc/prometheus/consoles'
      - '--storage.tsdb.retention.time=200h'
      - '--web.enable-lifecycle'
    restart: on-failure
    networks:
      - net
    labels:
      org.label-schema.group: "monitoring"

  alertmanager:
    image: prom/alertmanager:v0.21.0
    container_name: alertmanager
    volumes:
      - ./alertmanager:/etc/alertmanager
    command:
      - '--config.file=/etc/alertmanager/config.yml'
      - '--storage.path=/alertmanager'
    restart: on-failure
    networks:
      - net
    labels:
      org.label-schema.group: "monitoring"

  nodeexporter:
    image: prom/node-exporter:v1.0.1
    container_name: nodeexporter
    volumes:
      - /proc:/host/proc:ro
      - /sys:/host/sys:ro
      - /:/rootfs:ro
    command:
      - '--path.procfs=/host/proc'
      - '--path.rootfs=/rootfs'
      - '--path.sysfs=/host/sys'
      - '--collector.filesystem.ignored-mount-points=^/(sys|proc|dev|host|etc)($$|/)'
    restart: on-failure
    networks:
      - net
    labels:
      org.label-schema.group: "monitoring"

  cadvisor:
    image: gcr.io/cadvisor/cadvisor:v0.38.7
    container_name: cadvisor
    volumes:
      - /:/rootfs:ro
      - /var/run:/var/run:rw
      - /sys:/sys:ro
      - /var/lib/docker:/var/lib/docker:ro
      - /etc/machine-id:/etc/machine-id:ro
      - /var/lib/dbus/machine-id:/var/lib/dbus/machine-id:ro
      #- /dev/kmsg:/dev/kmsg:rw
    #command: ["start", "--privileged"]
    restart: on-failure
    devices:
      - /dev/kmsg:/dev/kmsg
    networks:
      - net
    labels:
      org.label-schema.group: "monitoring"

  grafana:
    image: grafana/grafana:7.3.7
    container_name: grafana
    volumes:
      - grafana_data:/var/lib/grafana
      - ./grafana/provisioning:/etc/grafana/provisioning
    environment:
      - GF_SECURITY_ADMIN_USER=admin
      - GF_SECURITY_ADMIN_PASSWORD=admin
      - GF_USERS_ALLOW_SIGN_UP=false
    restart: on-failure
    networks:
      - net
    environment:
      - VIRTUAL_HOST=dockprom.domain.com
      - LETSENCRYPT_HOST=dockprom.domain.com

    labels:
      org.label-schema.group: "monitoring"

  pushgateway:
    image: prom/pushgateway:v1.3.1
    container_name: pushgateway
    restart: on-failure
    networks:
      - net
    labels:
      org.label-schema.group: "monitoring"
If you're curious, you can check and compare the above file with the official Dockprom design.

Setting up docker host and container monitoring
Now since I've shared what the Dockprom Stack implements with the official definitions of the server monitoring tools, let me now list the step-by-step process of deploying this Nginx based design of Dockprom along-with the essential cAdvisor fixes.
For testing purpose, you can use a 1 GB nanode on Linode to try out the configuration but for production purpose, the server is required to have at least 4 GB. This is mainly because of Prometheus.

Step 1: Fetch the official Dockprom configuration
Open a terminal on the server and enter the following command:
git clone https://github.com/stefanprodan/dockprom
cd dockprom
Step 2: Revise the docker-compose.yml file
As I have discussed and shared the Nginx based docker-compose.yml file just a while ago under Node Exporter section. Please edit the file and revise it.
Step 3: Launch the Config!
Assuming you are in the same dockprom directory, run the Docker Compose command to launch the Dockprom Stack:
docker-compose up -d
Step 4: Access the Dockprom Stack through Grafana
Remember you set your access URL additionally inside the Grafana config for web access? Now you can use it to gain complete access to the Stack.
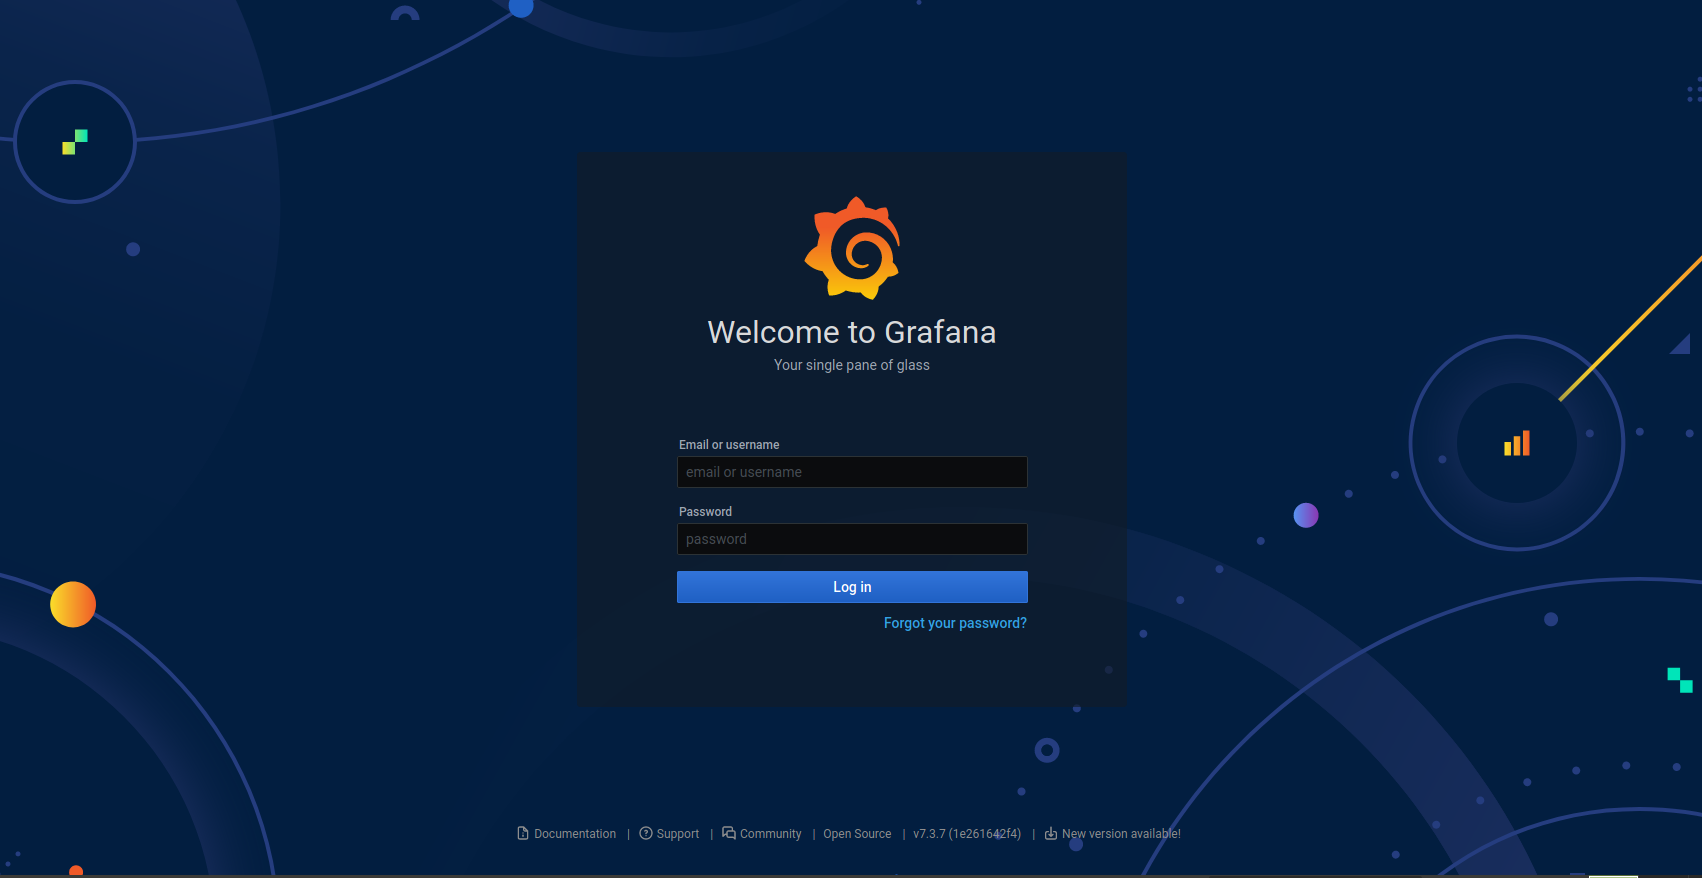
Both the username and password had been set to admin. Changing it to a strong password is highly recommended. A typical web login panel looks like:
Wait for sometime for the interface to load up:
Bonus Tip
After you log in to Grafana, navigating quickly to the metrics statistics can be overwhelming at first, which is why I'll share the direct link to the dashboard panel for immediate access: https://dockprom.domain.com/dashboards
As you can see, you only need to add /dashboards to your own domain or subdomain. From this page, you can monitor metrics for:
- Docker Containers
- Host System
- Prometheus
- Nginx
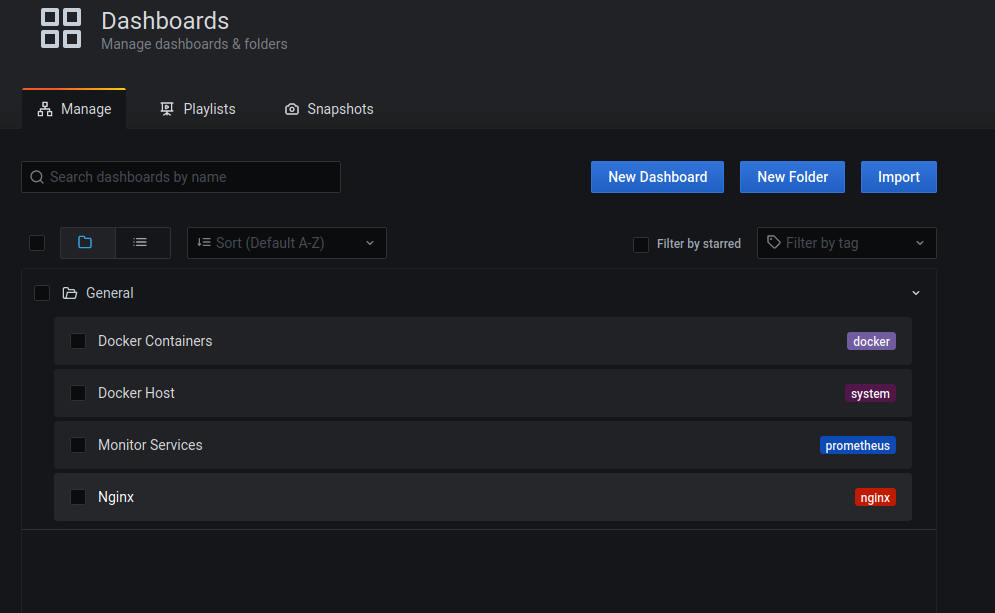
Please note that Nginx (4th and last one on the above list) would show empty stats if not directly installed on the host. This should not be confused with Jwilder Nginx since it is running on Docker. You would have to monitor the Nginx container specifically in such a case.
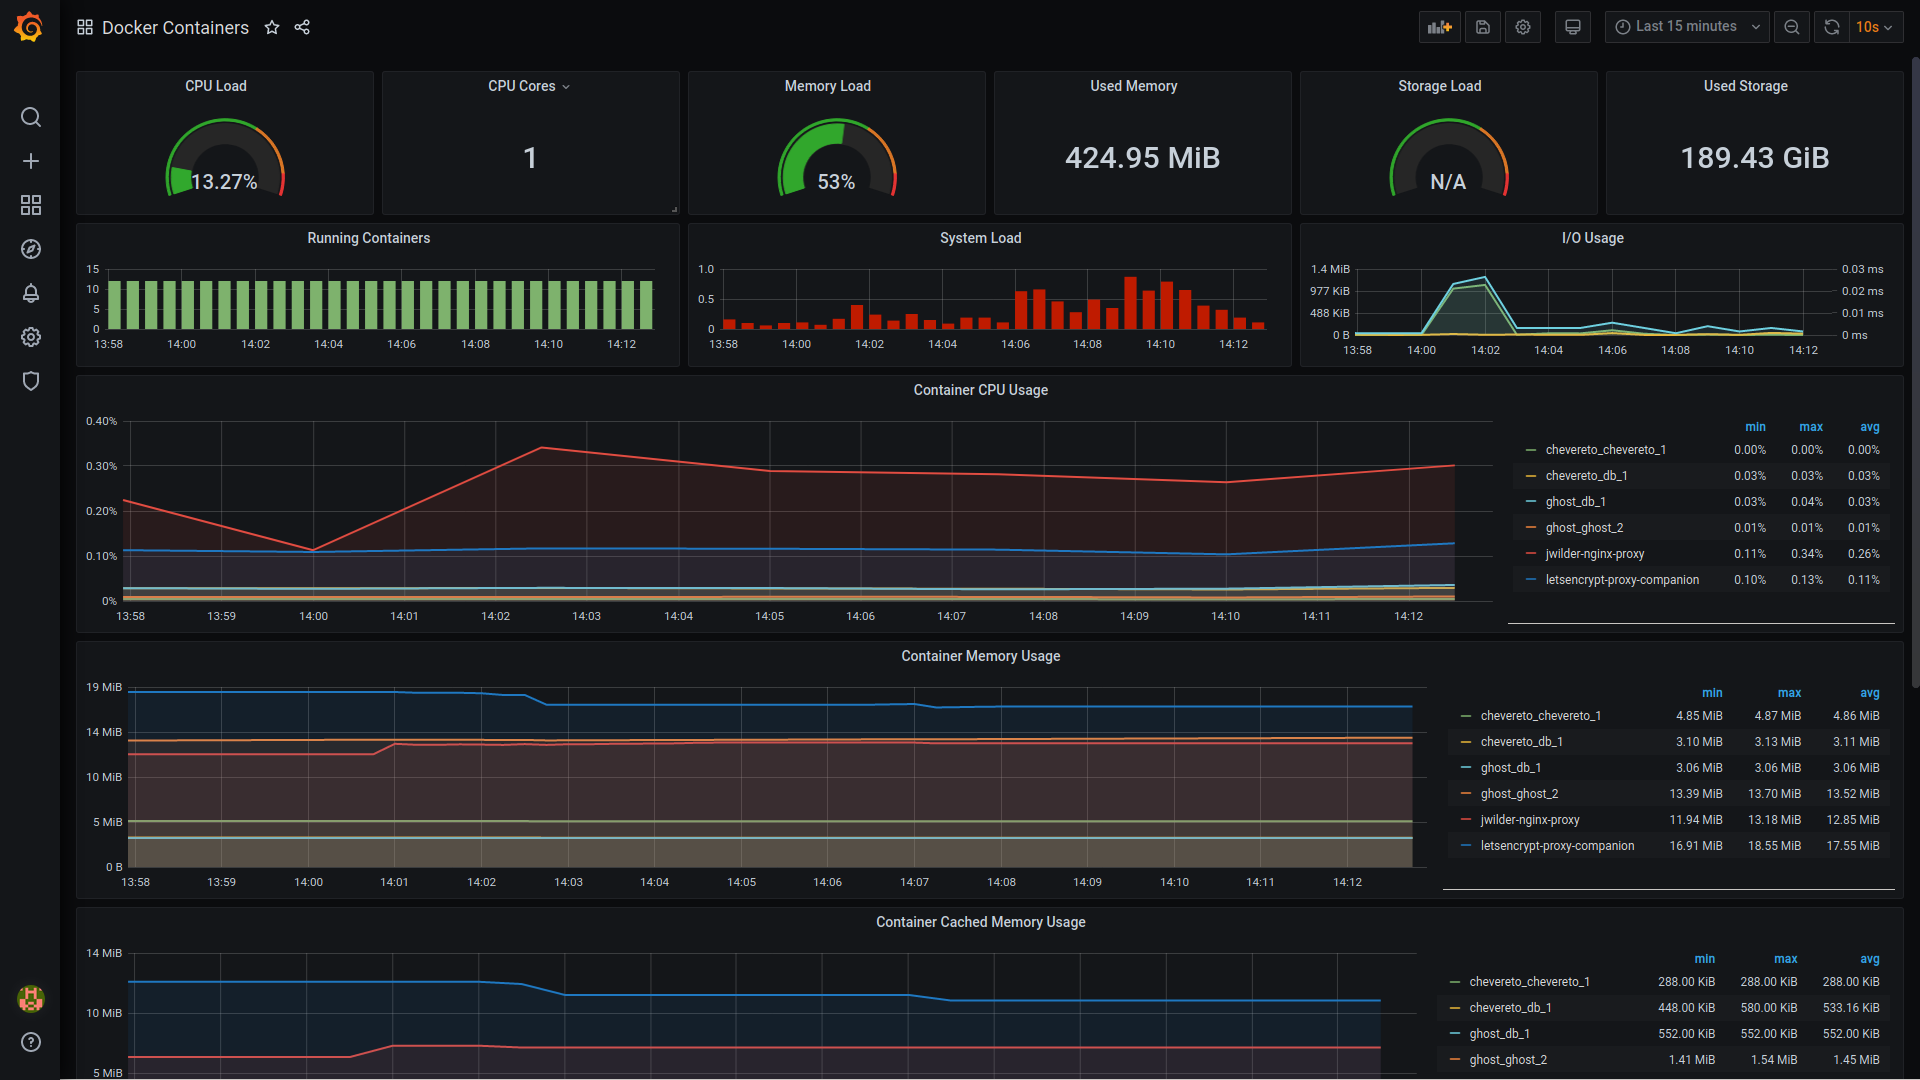
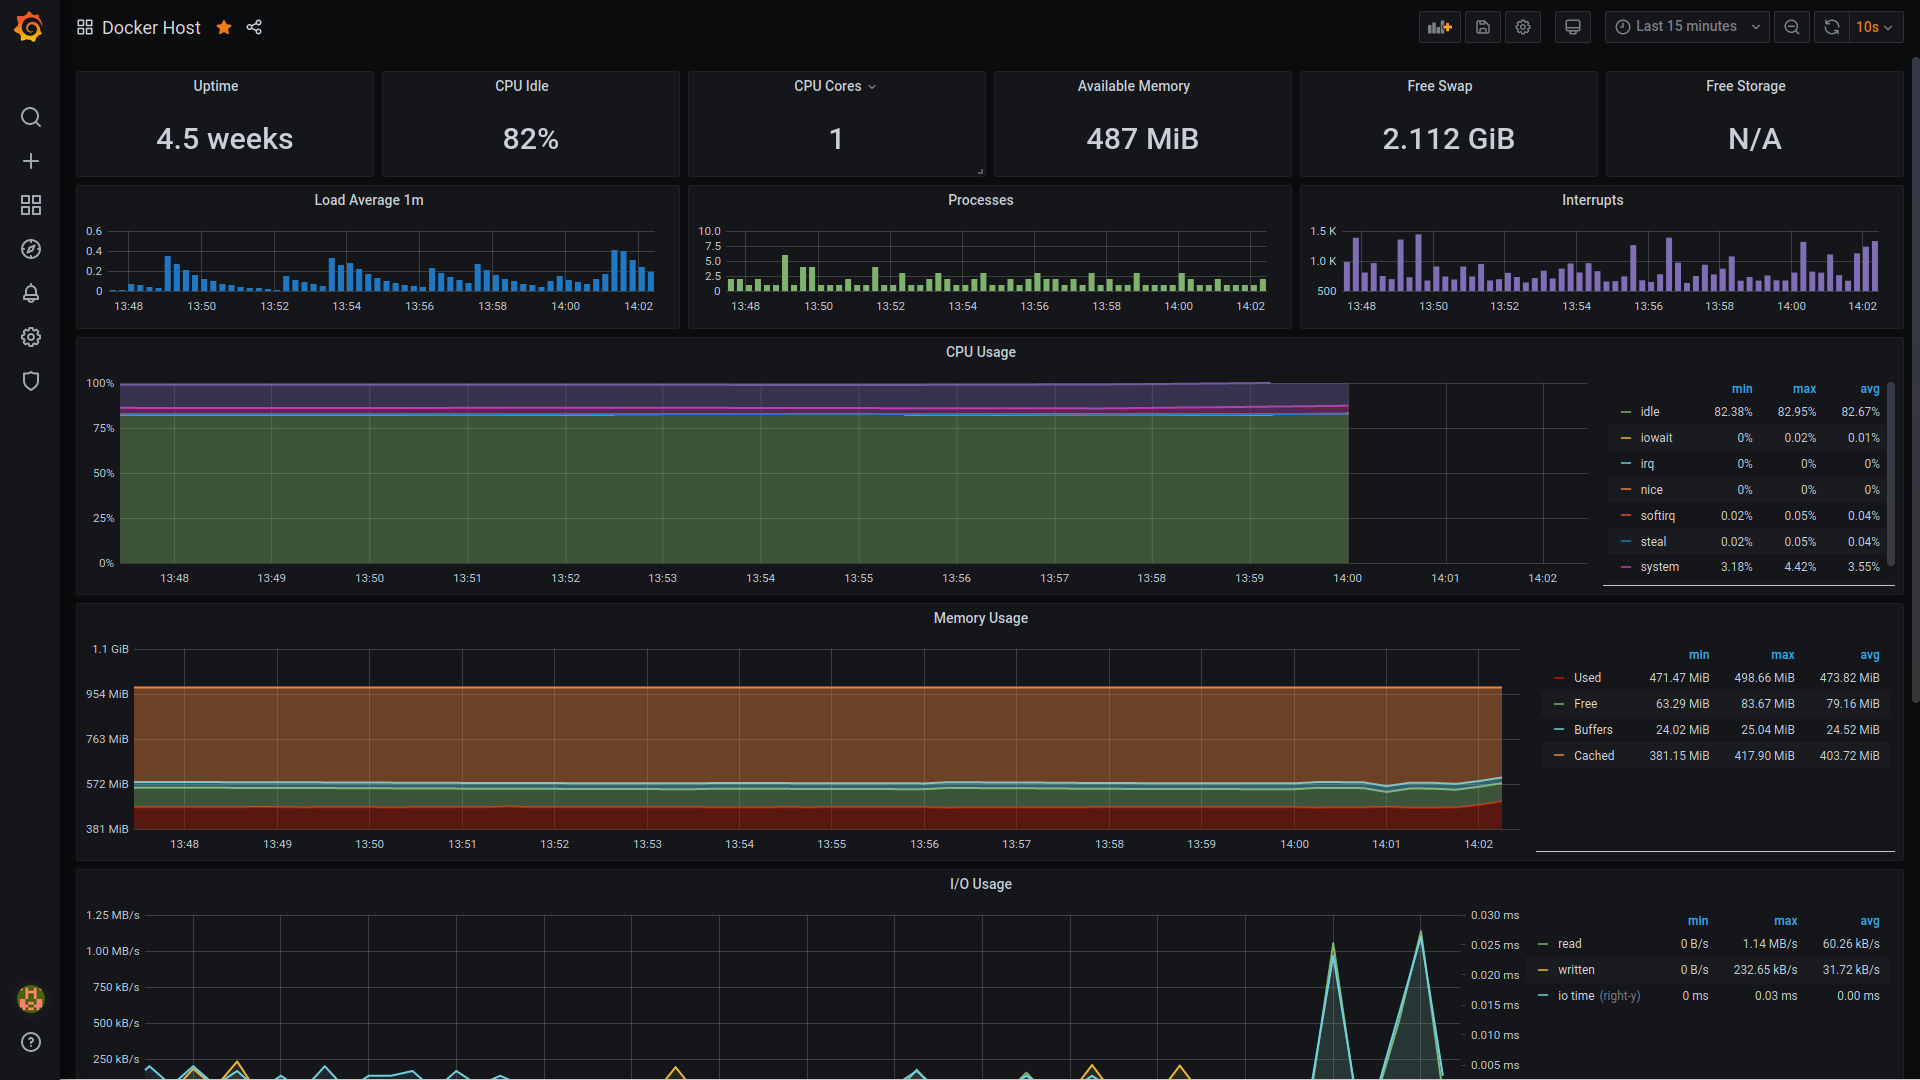
Here's the Grafana screen for Docker host monitoring:
I had already shared the container monitoring screenshot at the beginning of this article:

I hope this brief tutorial helps you in setting up this resourceful stack on your server. Again, this is useful for a single server. If you have containers on multiple servers, you may use Swarmprom from the same developer.
stefanprodanIf you have any comments or suggestions, please do not hesitate to share your views in the section below.
