
It is said that information is power, and the sar Linux command can give you tons of useful information about your system.
It is named like that for System Activity Reporter (SAR), and allows you to query information to your system, to understand what is happening or what has happened in the past.
It runs in the background gathering your system information as a daemon, writing the current day to text files and converting these to binary files as midnight passes.
The best thing is that it stores the data. So unlike top and many other system monitoring commands, you can get a historical view of system resource utilization.
This is helpful when you want to see if a performance deterioration matches with the high resource usage at the time.
Installing sar command
The sar command comes in the sysstat package, which normally will not come by default in Debian or RedHat based distros, so you will have to install it first.
sudo apt install sysstatOnce this package is installed, you need to start sar service, by doing:
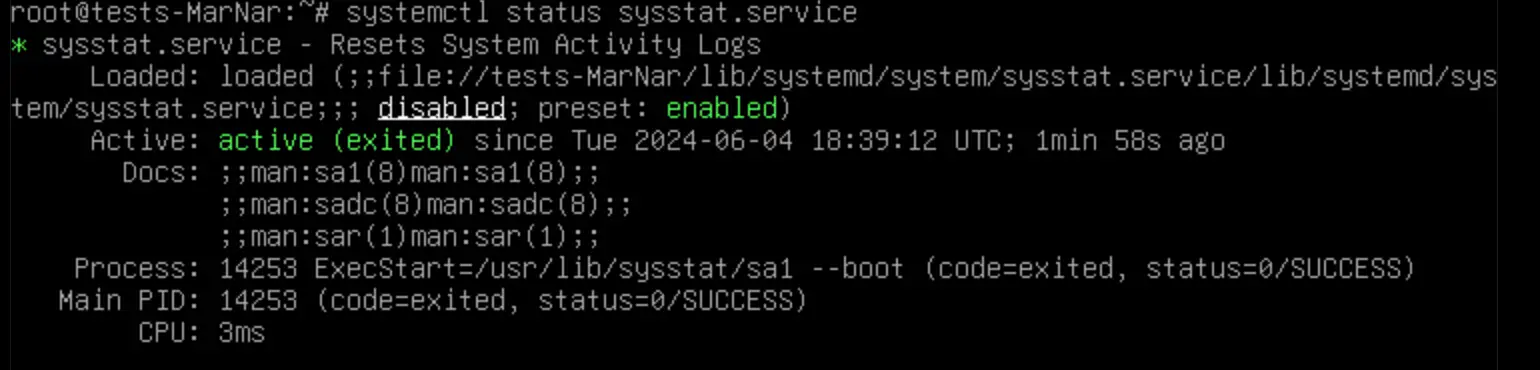
systemctl start sysstat.serviceThis will start the service, which you can easily check if it is running by doing:
systemctl status sysstat.serviceAnd you will see results similar to this:
Using sar command to get system details
Now that you have the sar running in the background and collecting the stats, let's see how you can access that information.
CPU Stats
To check the CPU resource, run the sar command with -u option:
sar -uIt will show the CPU stats collected for the day.
11:50:00 AM     CPU     %user     %nice   %system   %iowait    %steal     %idle
12:00:01 PM     all     16.22      0.52      3.83      0.44      0.00     79.00
12:10:01 PM     all      9.19      0.00      2.15      0.21      0.00     88.45
12:20:01 PM     all     11.73      0.06      2.70      0.30      0.00     85.21
12:30:01 PM     all      6.03      0.00      2.04      0.16      0.00     91.76
12:40:01 PM     all      1.43      0.00      0.44      0.15      0.00     97.98
12:50:01 PM     all      8.70      0.00      2.36      0.23      0.00     88.71
01:00:01 PM     all      9.10      0.00      2.51      0.21      0.00     88.18
01:10:01 PM     all     11.96      0.00      2.81      0.28      0.00     84.95
Average:        all      9.28      0.07      2.35      0.25      0.00     88.04
You can also ask sar to show you usage at a different time interval.
Let's say you want to watch and monitor the CPU usage stats for 3 times at an interval of 7 seconds:
sar -u 7 3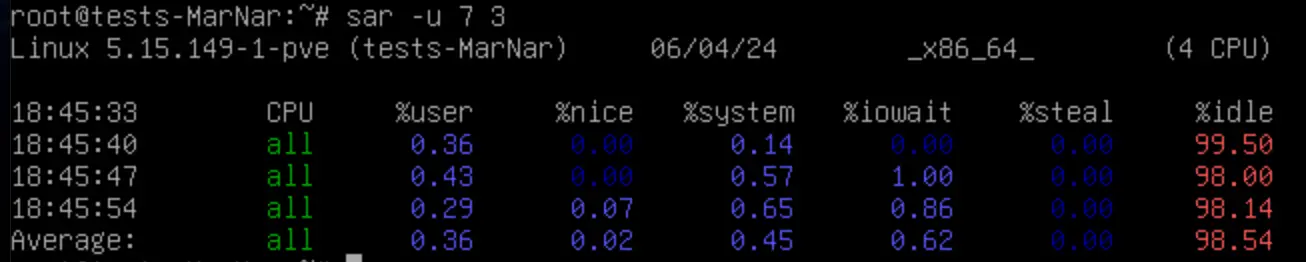
It will give you 3 snapshots, taken in the period requested, and an average of those numbers obtained in all snapshots.
You can see it gives you the percentage of usage, the percentage of "nice", the percentage used by the system, the percentage of IO wait, the percentage of steal and the percentage idle.
If desired, you can even ask it about specific CPU usage like this:
sar -P 1 1 3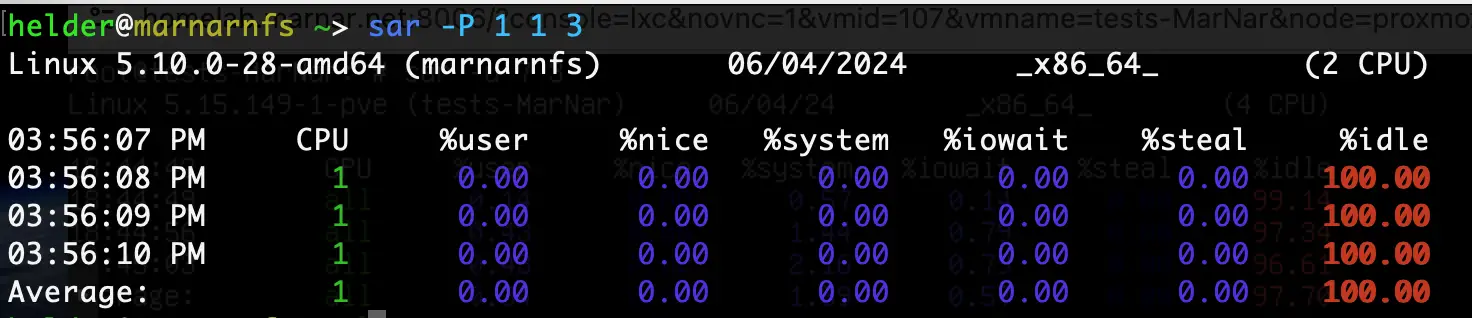
Check mounted file system usage
The sar command can also give you a lot of information about your File System.
In this example, I am going to request information about the filesystems mounted in the system 4 times in intervals of 2 seconds:
sar -F 2 4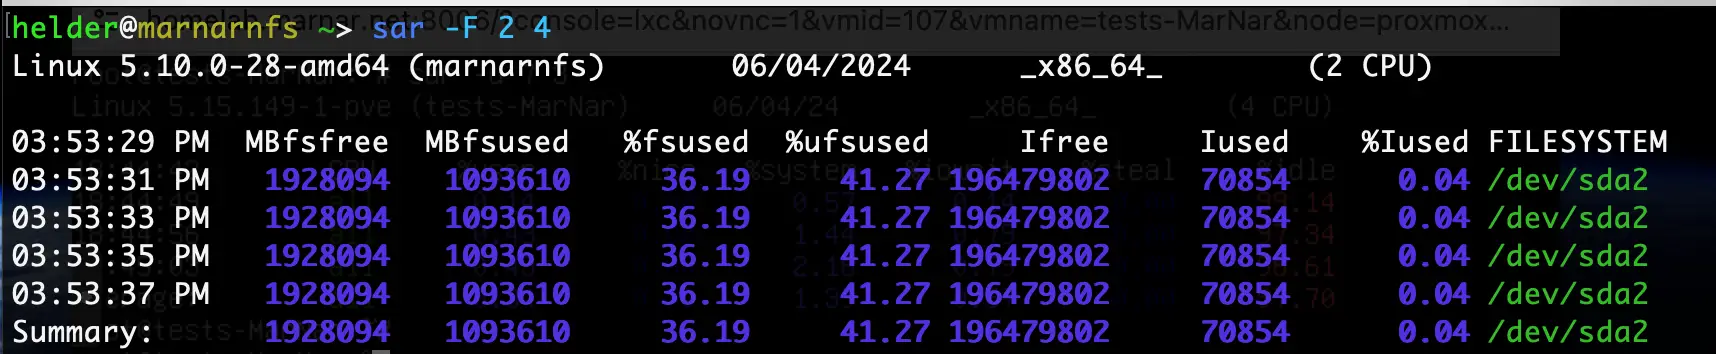
It will not only give you the number of megabytes used and free but also inform you about the inodes free and used and the file system location.
Network report is also available
You can get a lot of information about your network, for example: network interface, network speed, IPV4, TCPV4, ICMPV4 network traffic and errors.
sar -n DEV 1 3 | egrep -v lo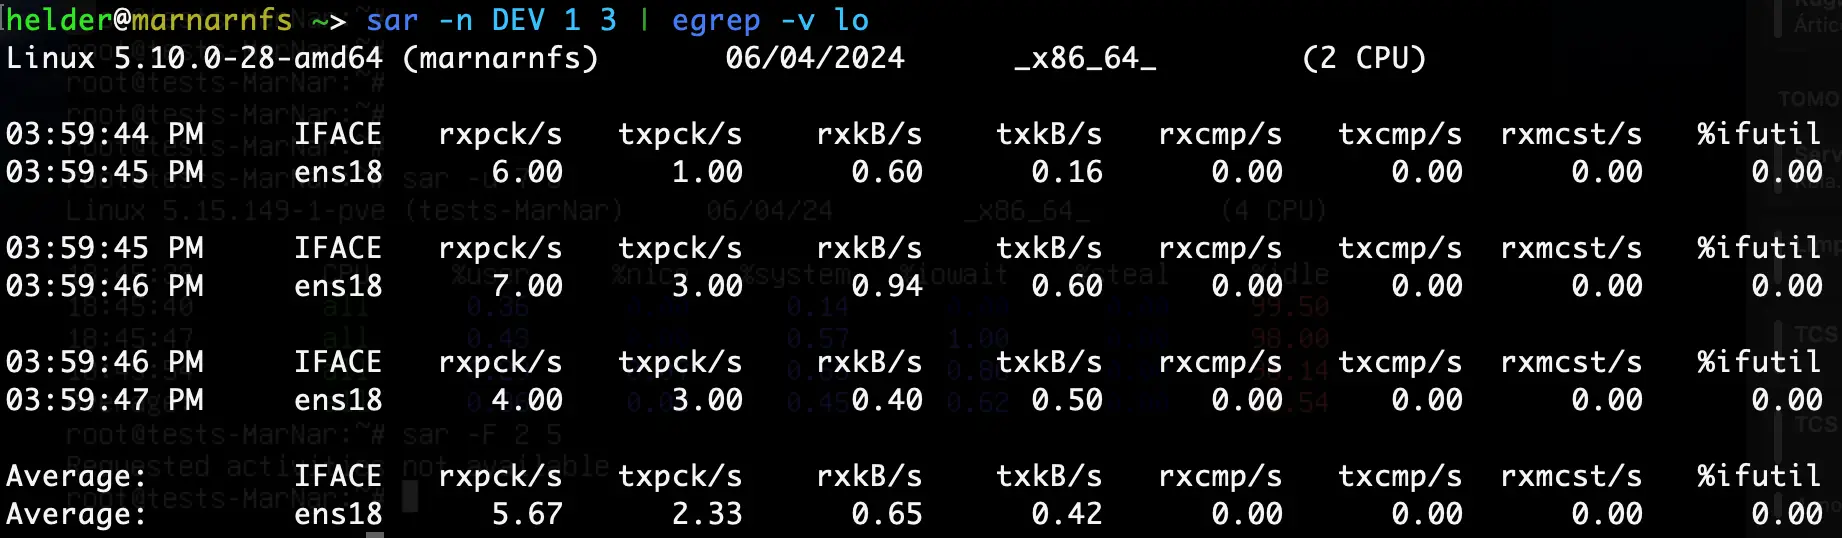
Getting historical stats
You can obtain historical stats by quering the sar command with a specific timeframe. Let's say you want to know CPU stats from 8 AM to 2 PM for the current day, you would use this:
sar -u -s 8:00:00 -e 14:00:00 Conclusion
I find it surprising that sar doesn't provide a utility to display the system resource usage in graphs.
If you want that, you can use some third-party tools like sargraph.
 sargraph
As I mentioned at the beginning, the power of sar command is incredible, there are plenty more options to use with it, which will allow you to get a lot more information which is very deep about your system such as: Process, Kernel Thread, I-node, and File Table Details, Swapping Statistics, Messages, Semaphores, and Process Details, I/O Operation Details and much, much more.
You can get the list of different options, by running:
sar --helpWhich will allow you to see the ser of options the command has to be able to provide deep understanding of the system statistics that can help any administrator to understand what is happening in the system at any moment in time.