How to Check CPU Usage in Linux Command Line
As a sysadmin, it is important to keep a tab on the CPU usage. Here's how to do that in the Linux terminal.

As an SRE or Linux Administrator, you need to keep an eye on your different servers, virtual machines, hypervisors, etc; and make sure they don't have any zombie processes or things sucking up all CPU power.
This is something that can be done in several ways through the command line, and depending on how it is done, you can get the information you need in different ways.
Here are some common ways to check the CPU usage in Linux:
top command
This is probably the most common way and the most known by any Linux administrator. This simple command can provide not only CPU but also RAM and even system performance information.
It automatically refreshes every 5 seconds, so it's a great tool to have a "top" view of the system. It also gives you information on what processes are running and how much CPU and RAM each consumes.
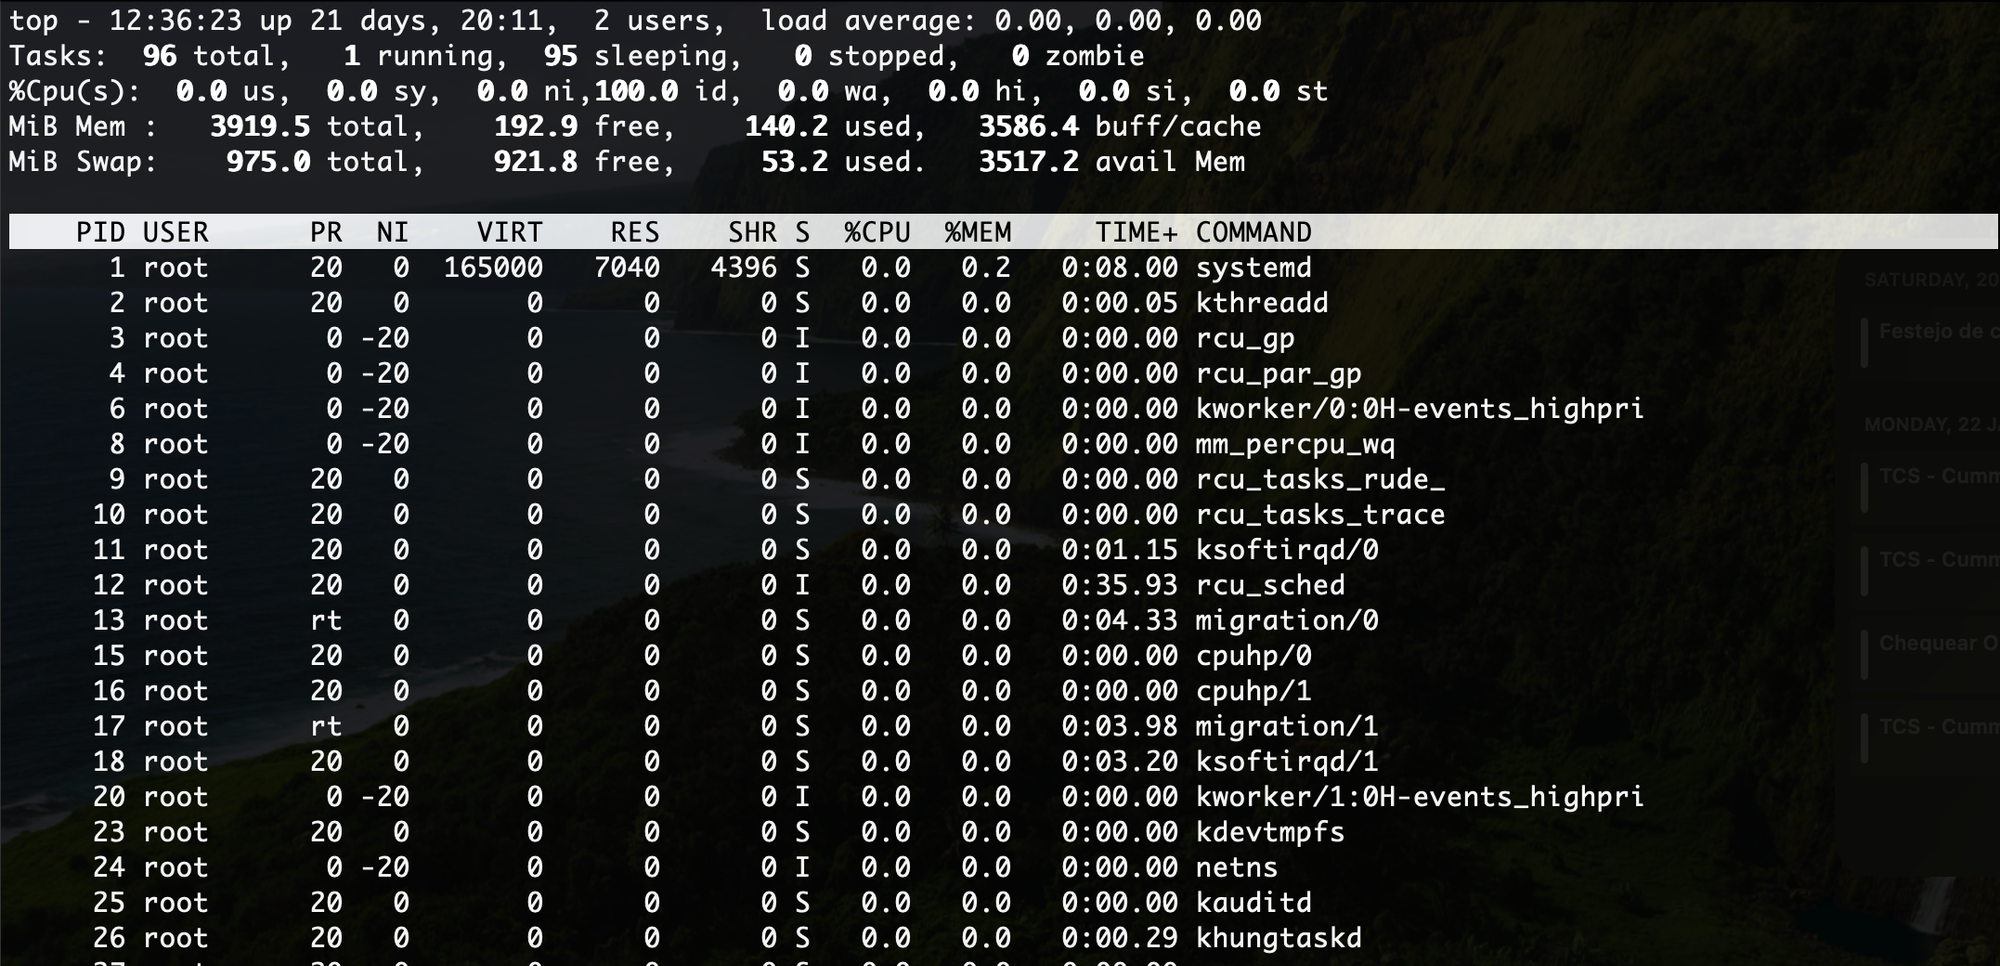
Reading the top command output
This command gives you a bunch of information that might look like too much on the naked and untrained eye. Let's quickly summarize and recap what you should consider from this command:
- PID – Process ID, just a simple identifier of each process running.
- USER – Is the username that owns the specific process in the same row
- PR – Refers to the priority of the task
- NI – Nice value of the task. A negative nice value means higher priority, whereas a positive nice value means lower priority.
- %CPU – CPU usage being used by the task since the last screen update, expressed as a percentage of total CPU time.
- TIME+ – How long has been the task using the CPU.
- COMMAND - the name of the command executed to generate the task.
It has different filters such as:
- U gives you all processes owned by specific User.
- M sorts all running processes by the amount of Memory they are using.
- P sorts all running processes by the amount of CPU they are using.
- I hides all Idle processes.
sar command
This command allows you to not only monitor CPU usage in intervals but also save this system activity information in a file. It works similarly to top.
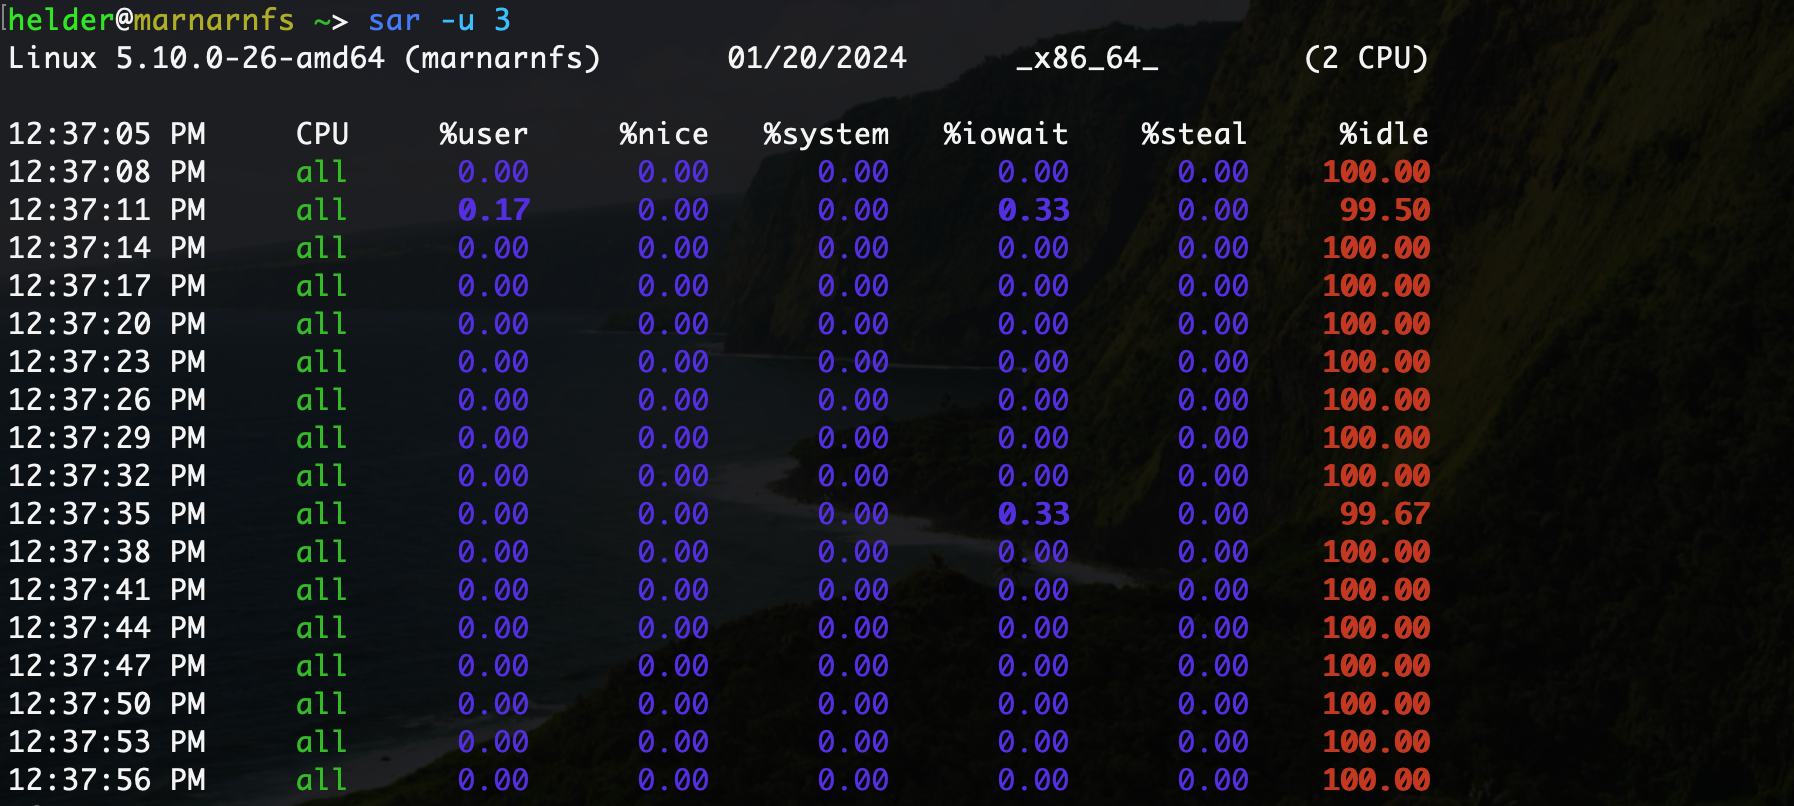
Reading the sar command output
The sar command gives less information and it's more straightforward in its read. Here is what each column is:
The time column just expresses the specific time (hour, minutes, and seconds) that the snapshot of the output has been taken.
- CPU: shows the number of the CPU core, or ALL for the average of all cores.
- %User: is the percentage of time spent running applications at the user level.
- %Nice: is the percentage of time spent running applications at the user level, with nice priority.
- %system: is the percentage of time spent executing processes at the system level, in the kernel.
- %iowait: is the percentage of time when the CPU was idle with a pending disk I/O request.
- %steal: In a virtual machine, this is the percentage of time the virtual CPU was idle because the real CPU was servicing a different virtual machine on the same host.
- %idle: The percentage of time when the CPU was idle without any pending disk I/O requests.
vmstat command
This is probably the command that more information outputs. It reports information about processes, memory, paging, block IO, traps, disks, and CPU activity.
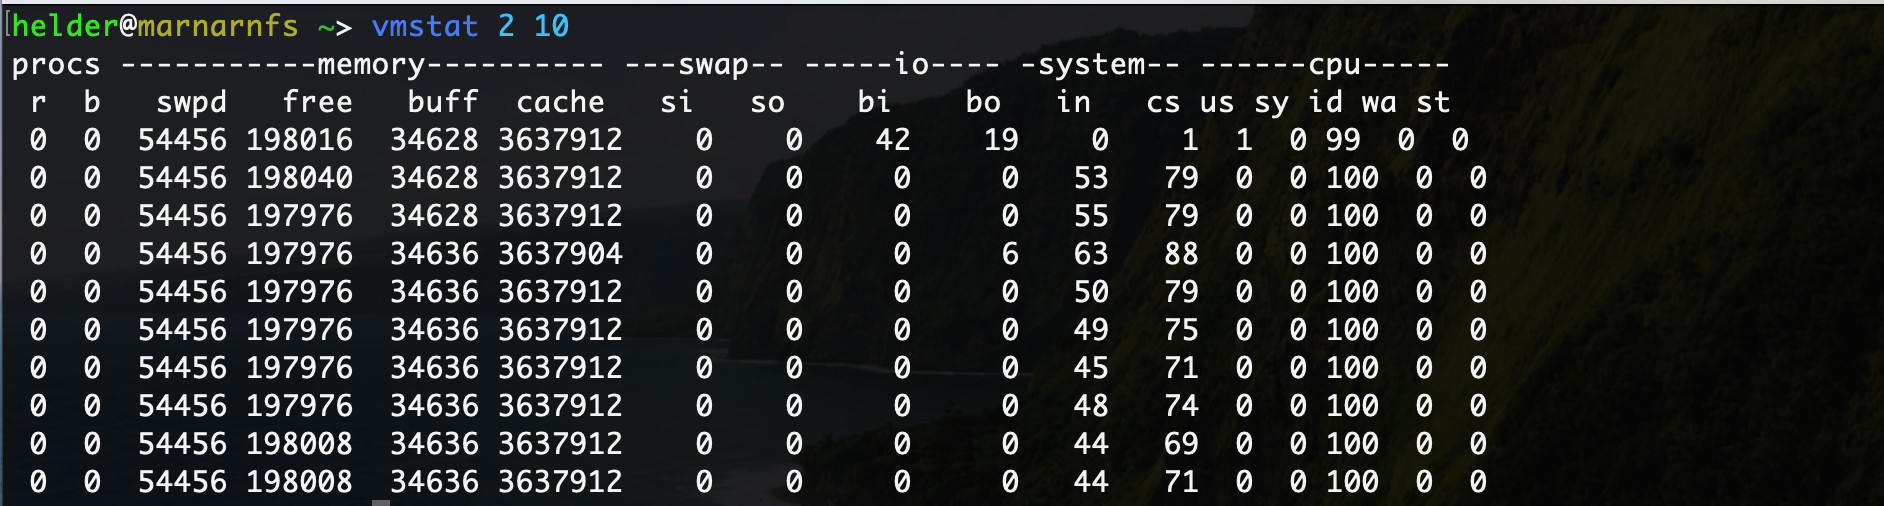
Reading vmstat command output
As this command outputs a lot of information, there is a lot to understand from it:
procs - this represents the number of processes running, the 'r' are the ones that are 'running' while the 'b' are the ones that are sleeping.
memory - this section has a lot of information about the memory:
- swap: the amount of virtual memory or swap space used.
- free: the amount of idle memory available.
- buff: the amount of memory being used as buffers.
- cache: the amount of memory being used as cache.
swap - in this section all swap memory usage is outputted:
- si: the amount of memory being swapped in from the disk (over a second).
- so: the amount of memory being swapped out to the disk (over a second).
io - represents the blocks of information traveling in and out:
- bi: blocks received from a block device (over a second).
- bo: blocks sent to a block device (over a second).
system - refers to a couple of things about the system:
- in: the number of interrupts per second, including the clock.
- cs: the number of context switches per second.
cpu - this column provides an overview of what is being done with the CPU time:
- us: the time spent running non-kernel code.
- sy: time spent running kernel code.
- id: the time spent as idle.
- wa: time spent for I/O.
- st: time stolen from a virtual machine (to be used on another one in the same host).
mpstat command
This command is probably not installed by default on the system, and it's part of a package named 'sysstat' which needs to be installed to get it.
It provides a singular snapshot of the CPU usage statistics if you run it naked, but you can specify it to give information about each of the CPUs in your server.
As this command is more CPU digging, certain handlers can give you the usage per processor in the server, and show the percentage of usage per hardware interrupts or node.
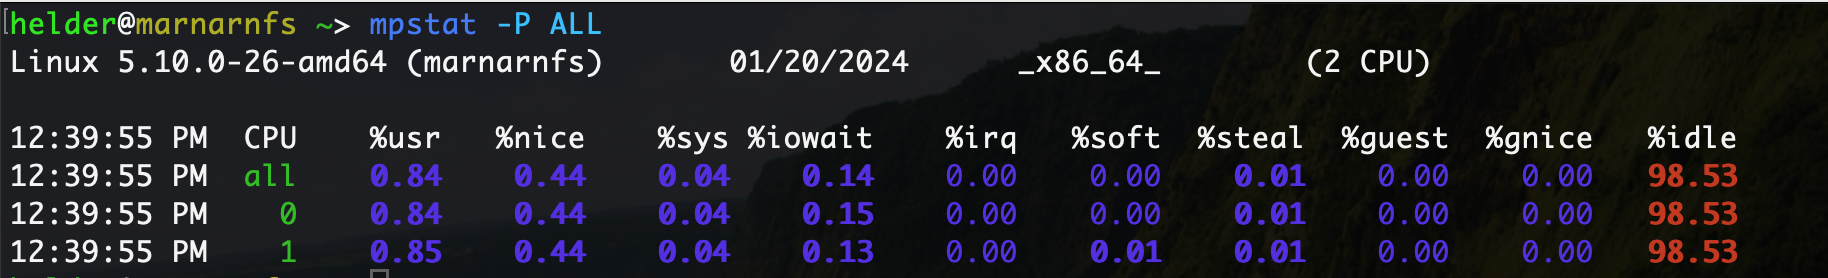
Reading mpstat command output
This command gives a lot of information all centered over the CPU:
- all: means All CPUs, while the 0 or 1 are the different cores.
- %usr: shows the percentage of CPU utilization while executing at the user level (application).
- %nice: shows the percentage of CPU utilization while executing at the user level with nice priority.
- %sys: shows the percentage of CPU utilization while executing at the system level (kernel).
- %iowait: show the percentage of time that the CPU or CPUs were idle during which the system had an outstanding disk I/O request.
- %irq: shows the percentage of time spent by the CPU or CPUs to service hardware interrupts.
- %soft: shows the percentage of time spent by the CPU or CPUs to service software interrupts.
- %steal: shows the percentage of time spent in wait by the virtual CPU or CPUs while the hypervisor was servicing another virtual machine.
- %guest: shows the percentage of time spent by the CPU or CPUs to run a virtual processor.
- %idle: shows the percentage of time that the CPU or CPUs were idle and the system did not have an outstanding disk I/O request.
iostat command
This command outputs the monitoring of the input/output device statistics, which includes not only CPU usage but also disk utilization and performance.
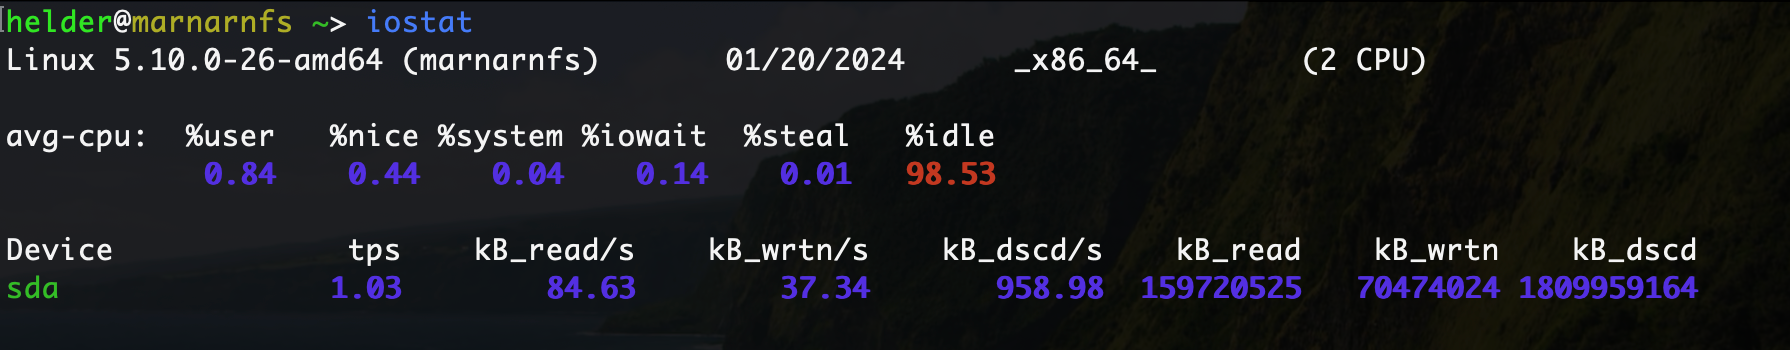
Reading iostat command
It gives a lot of useful information, which I summarize here:
CPU information:
- %user: shows the percentage of CPU being utilized while executing at the user level.
- %nice: shows the percentage of CPU utilized while executing at the user level with a nice priority.
- %system: shows the percentage of CPU utilized while executing at the system (kernel) level.
- %iowait: shows the percentage of the time that the CPU or CPUs were idle while the system had an outstanding disk I/O request.
- %steal: shows the percentage of time being spent waiting by the virtual CPU or CPUs while the hypervisor was servicing another virtual machine.
- %idle: It shows the percentage of time that the CPU or CPUs were idle and the system did not have an outstanding disk I/O request.
Device information:
Device: device/partition name listed in /dev directory.
- tps: number of transfers per second that were issued to the device. Higher tps means the processor is busier.
- Blk_read/s: shows the amount of data read from the device expressed in a number of blocks (kilobytes, megabytes) per second.
- Blk_wrtn/s: the amount of data written to the device expressed in a number of blocks (kilobytes, megabytes) per second.
- Blk_read: shows the total number of blocks read.
- Blk_wrtn: shows the total number of blocks written.
Getting a bit graphical
Even if you are working on the command line, you can get some nice options for graphical representations of the CPU usage. Here are some examples:
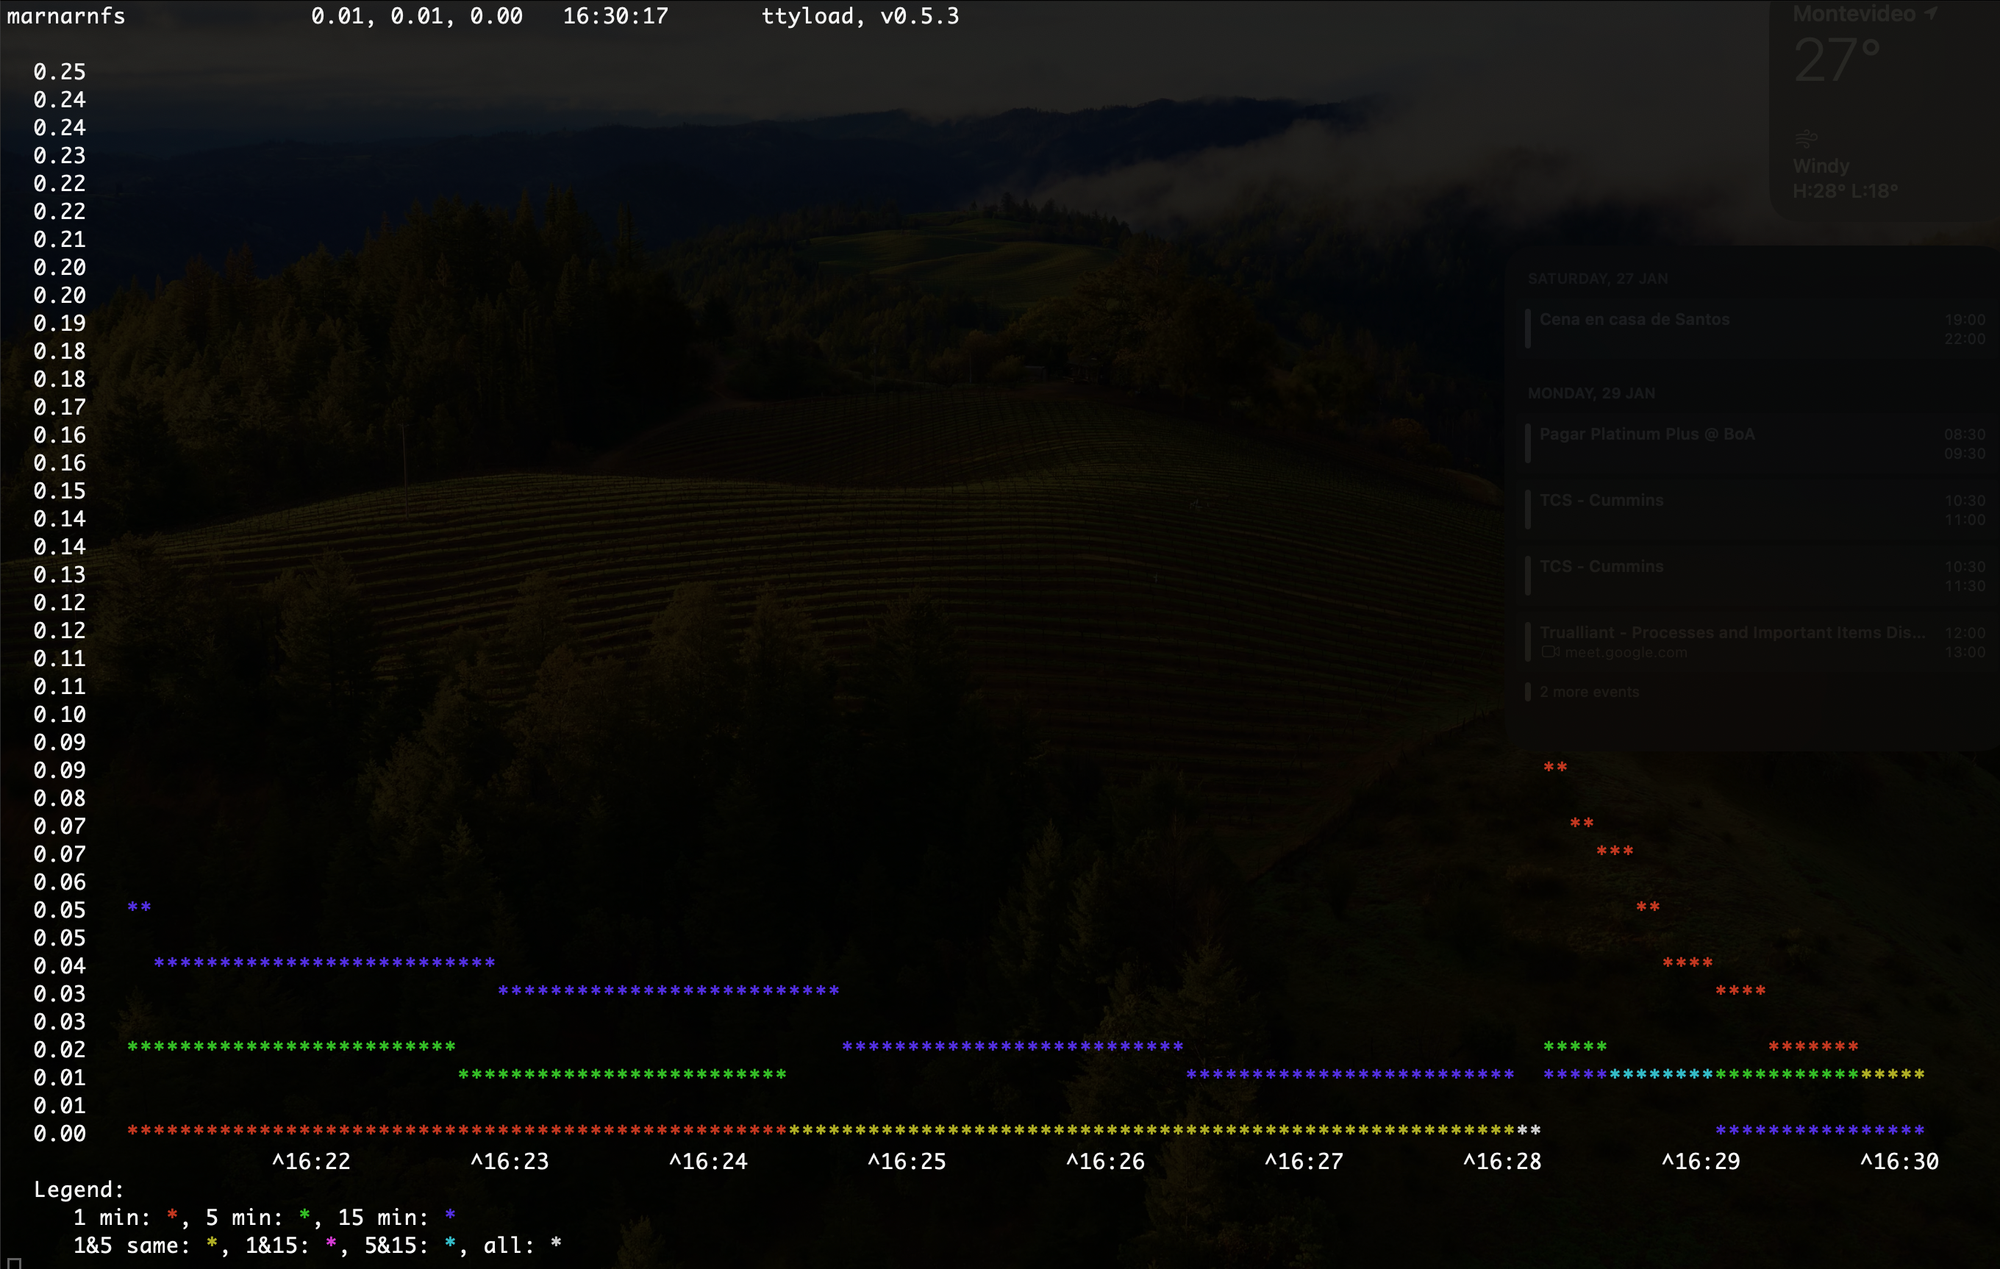
ttyload
This is a package available for Debian and Debian-based distros. You can simply install from regular repositories, and it will give you an asterixes graph of CPU usage averages taken 1-minute snapshots at a time in red, 5-minute snapshots at a time in green, and 15-minute snapshots at a time in blue – all three on one grid. The bigger time slices help put momentary spikes in a better perspective.
s-tui
Even though this is not a command, but an OpenSource Python application, it is very useful, as it gives you a lot of information. All using the command line.
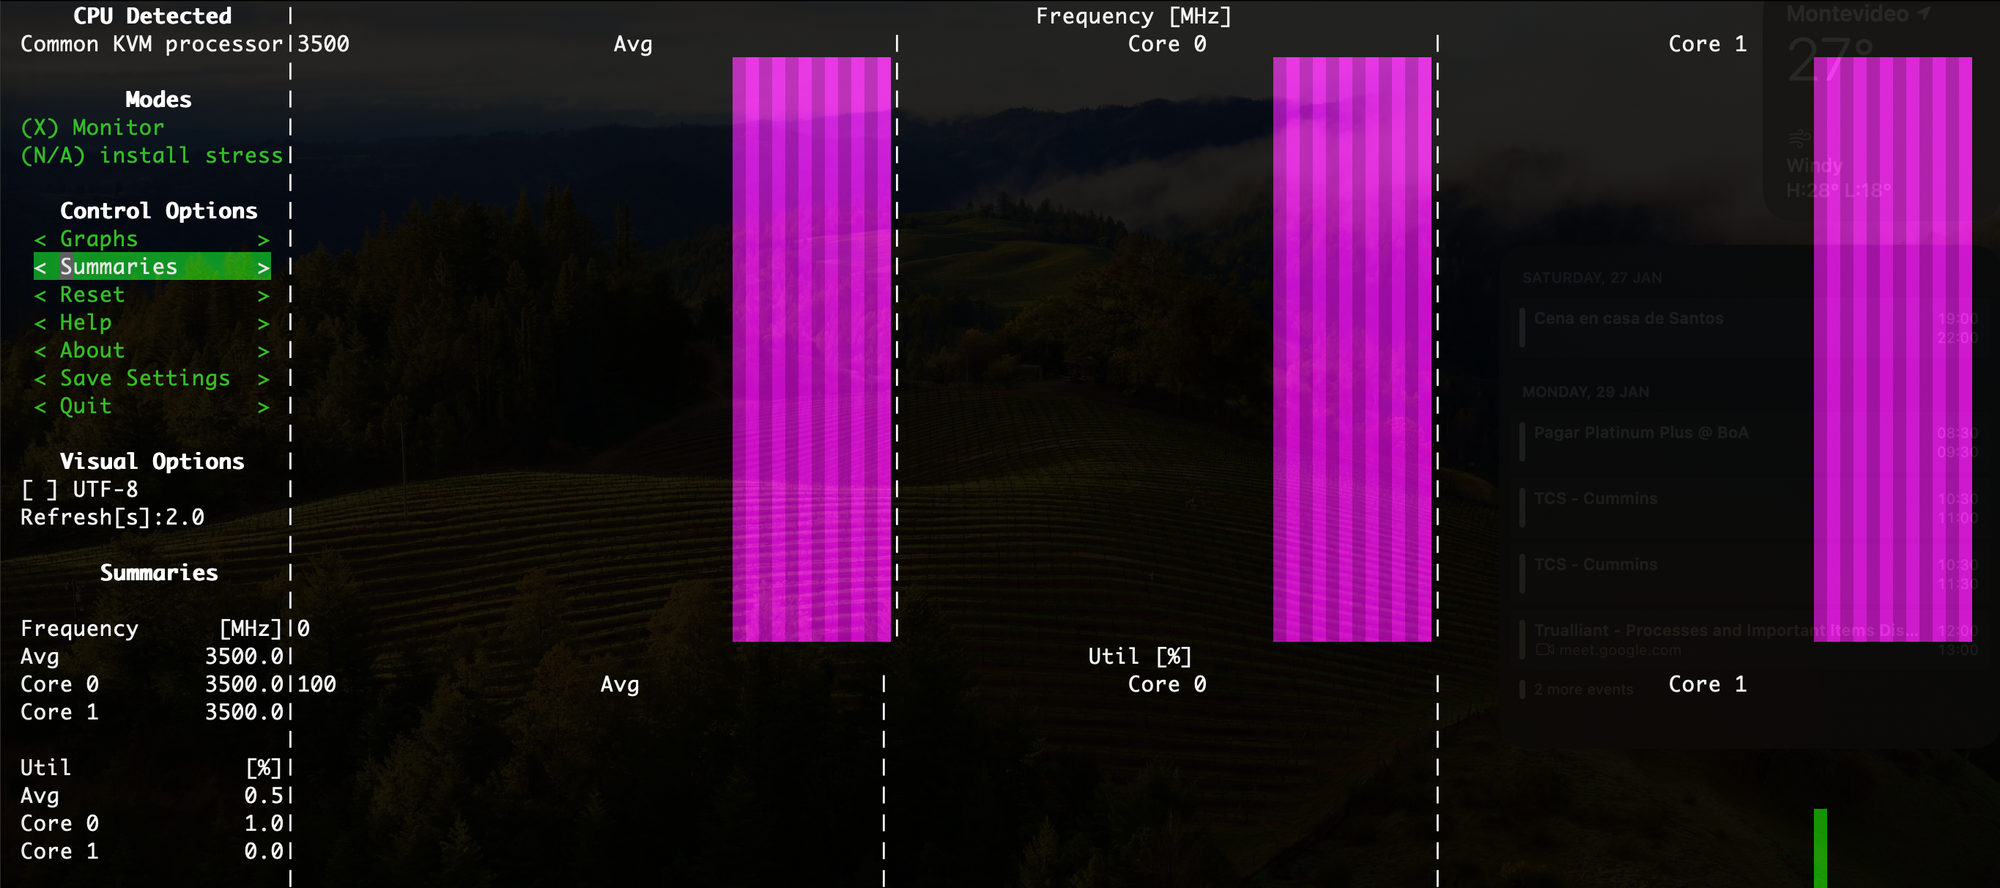
It shows you the type of CPU and allows you to browse with a mouse or keyboard among different menu items, allowing you to turn on and off options for display. It's like an entire reporting tool dedicated to your CPU.
As it is browseable, I will not cover its options as these can be turned on and off with just clicks or keystrokes, but it can even give you CPU temperature, frequency, information per CPU or node, a lot!
Conclusion
As you can see, different options will give you information related to your CPU, depending on the angle of your investigation or what you need to obtain, this is where lies the decision of which command you want to use.
Normally, commands are not simply used to monitor through command lines. Still, they are used within scripts which then work with the output obtained to perform certain automation or execute specific actions within the server, depending on the objective of the Administrator.