Using Cockpit to Monitor and Manage Multiple Linux Servers Graphically From a Web Browser
For the rare breed of sysadmins that do not like getting into the terminal, Cockpit is a god send for managing servers graphically.

How do you manage your Linux server(s)?
The most likely answer is by logging into the server via SSH and then using the Linux commands for all kind of tasks.
That's what most of us sysadmins do. But there is also a tiny percentage of the population who have to manage Linux servers despite not being too comfortable with the command line.
If you are one of those few people, I have good news for you. There are several tools that allow you to manage Linux servers graphically.
Webmin and Cockpit are the most popular tools in this category.

We have already covered Webmin on Linux Handbook. It's time to learn more on Cockpit.
What is Cockpit project for Linux?
Cockpit is a browser-based graphical administration tool for your Linux servers. With Cockpit installed on your server, you can access the server from a browser and perform all the regular admin tasks such as configuring firewall, changing network settings, manage storage, manage user accounts, run containers, install updates, update software and more. You can also analyze CPU load, memory usage, network activity and disk performance
If you are a bit familiar with Linux, Cockpit is a good option for administering servers graphically. Even if you are a seasoned sysadmin, Cockpit gives you the opportunity to have an overview of your servers.
I know modern utilities like Ansible are preferred these days but Cockpit is still a good choice for a variety of users.
Using Cockpit for managing Linux servers remotely but graphically
I am going to take you on a walkthrough of Cockpit and show you what you can do with it.
Install Cockpit on the server you want to monitor
You need to have Cockpit installed on the servers you want to monitor. Yes, you can monitor multiple servers from one Cockpit interface. I'll show the steps for multiple servers later.
For this quick tutorial, I'm going to install Cockpit on an Ubuntu 18.04 server:
sudo apt -y install cockpit
After that is done, you can now access the interface using port number 9090.
If you have physical access to the server, you can use the localhost in the web browser like this.
localhost:9090
You can access the Cockpit interface with your server's IP address and port number. For example, if your IP address is 1.2.3.4, your access URL would be:
1.2.3.4:9090Note that you would have to allow custom-https access for your web browser.
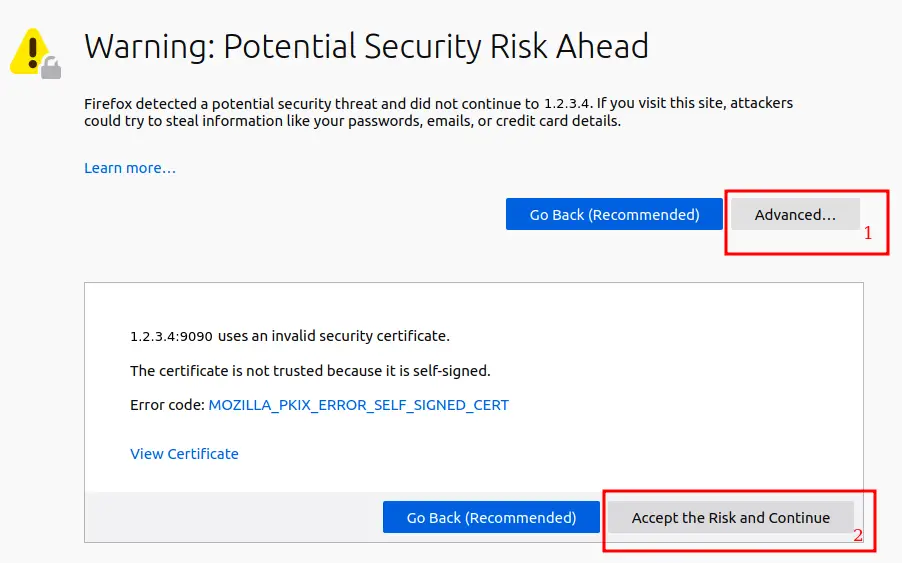
After that, you should see an interface like this:
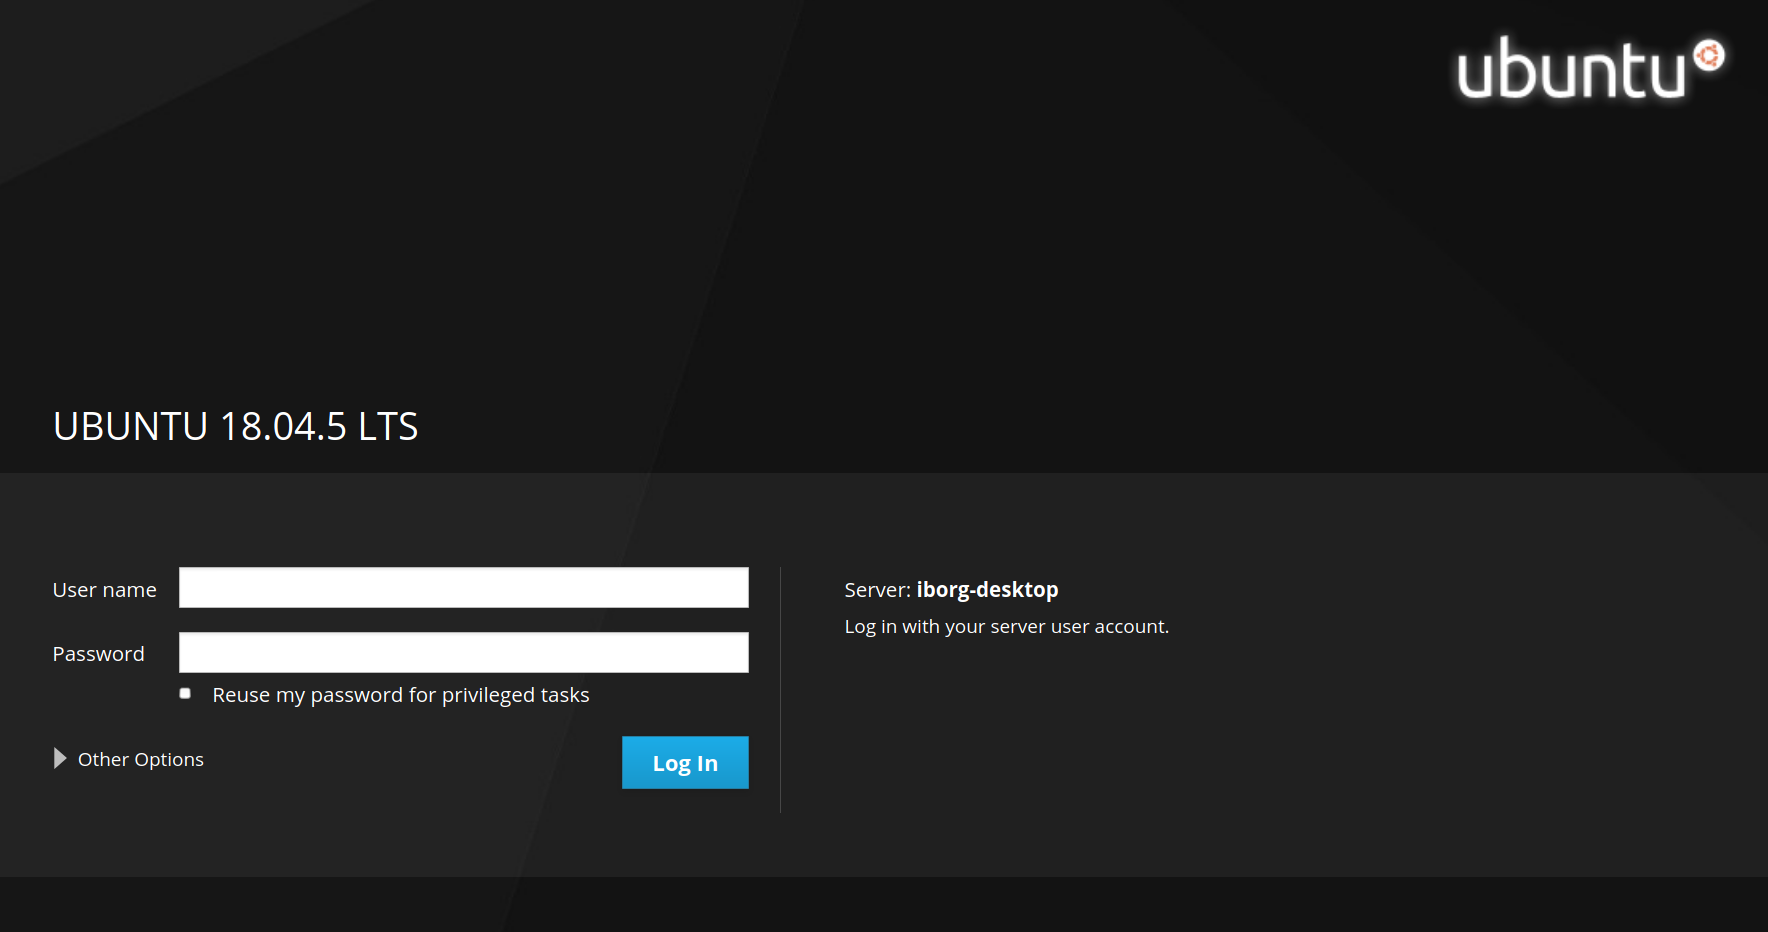
Do note that the username and password required here are the same credentials that you use for your server.
Also make sure that "Reuse my password for privileged tasks" is checked. It would be required to carry out administrative tasks after you log in.
Exploring Cockpit
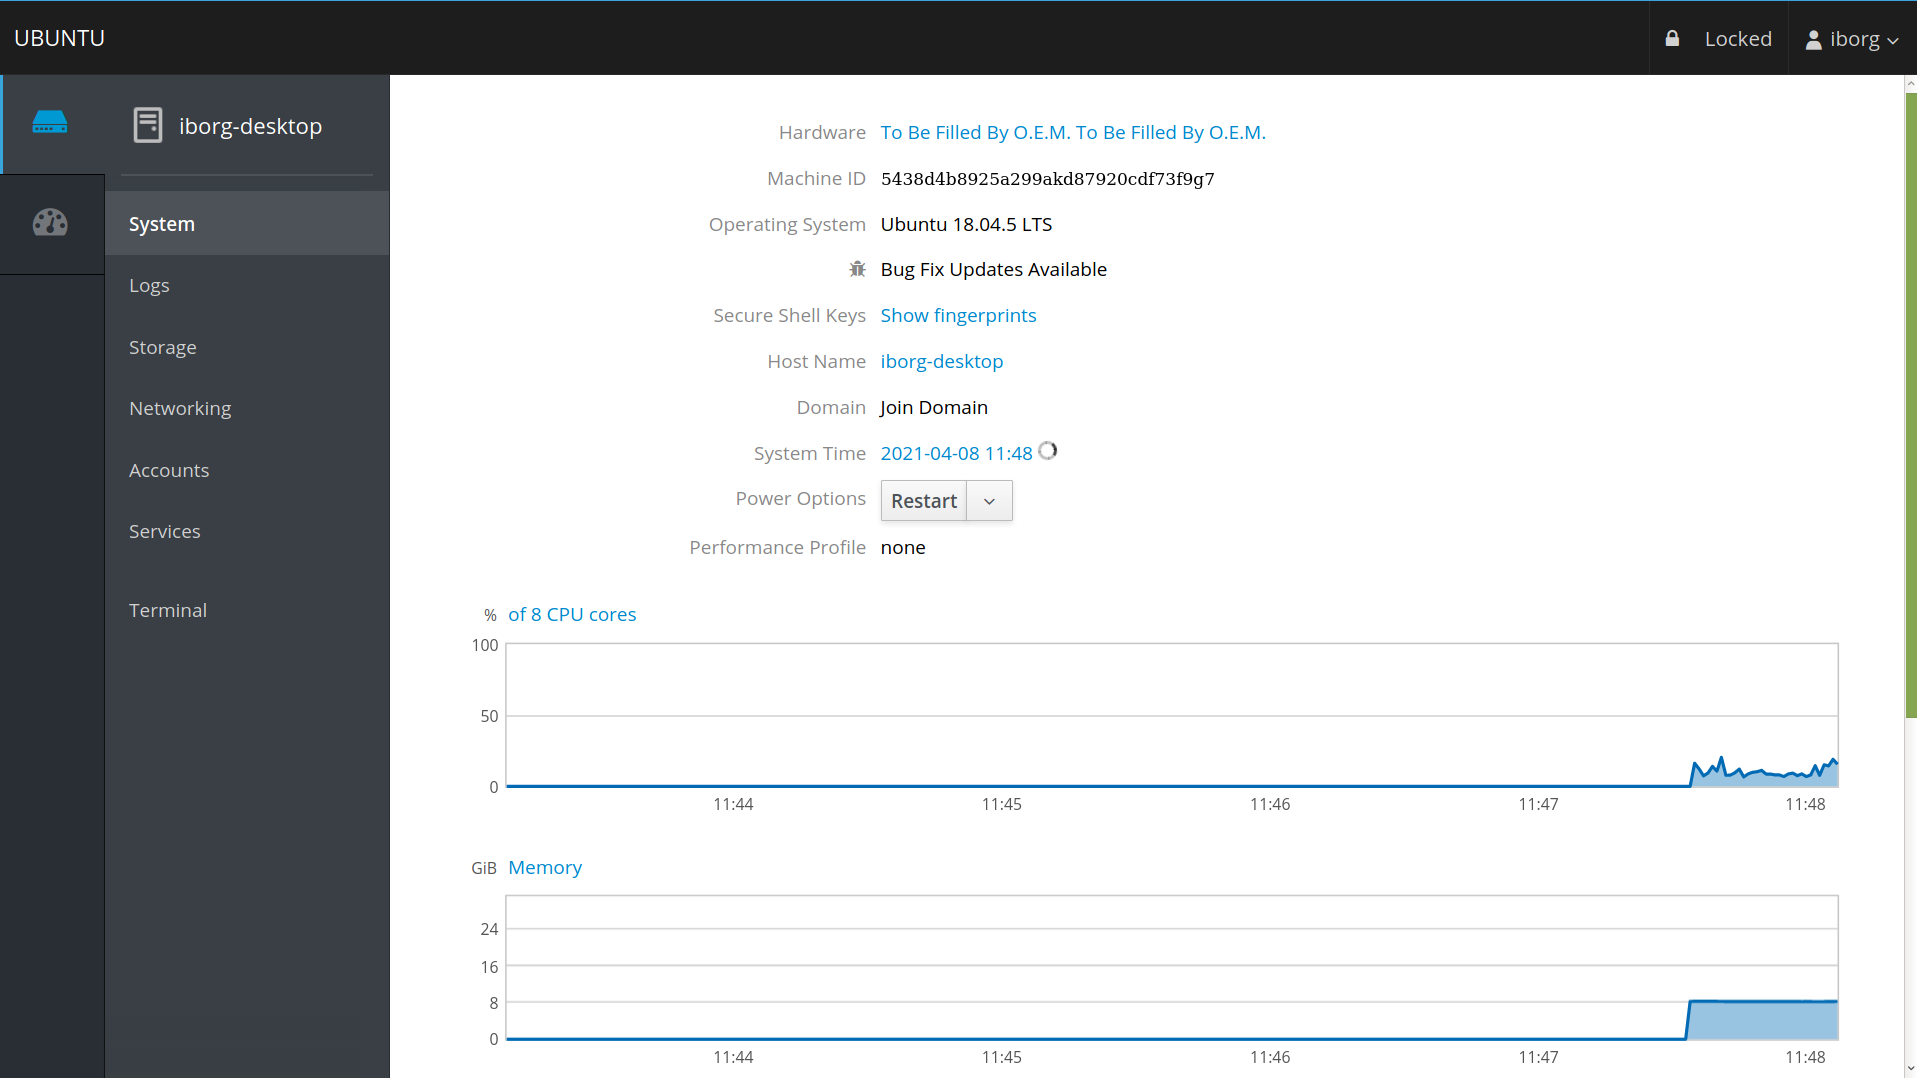
On first login, you'll be taken to the system overview page under the localhost settings:
System overview
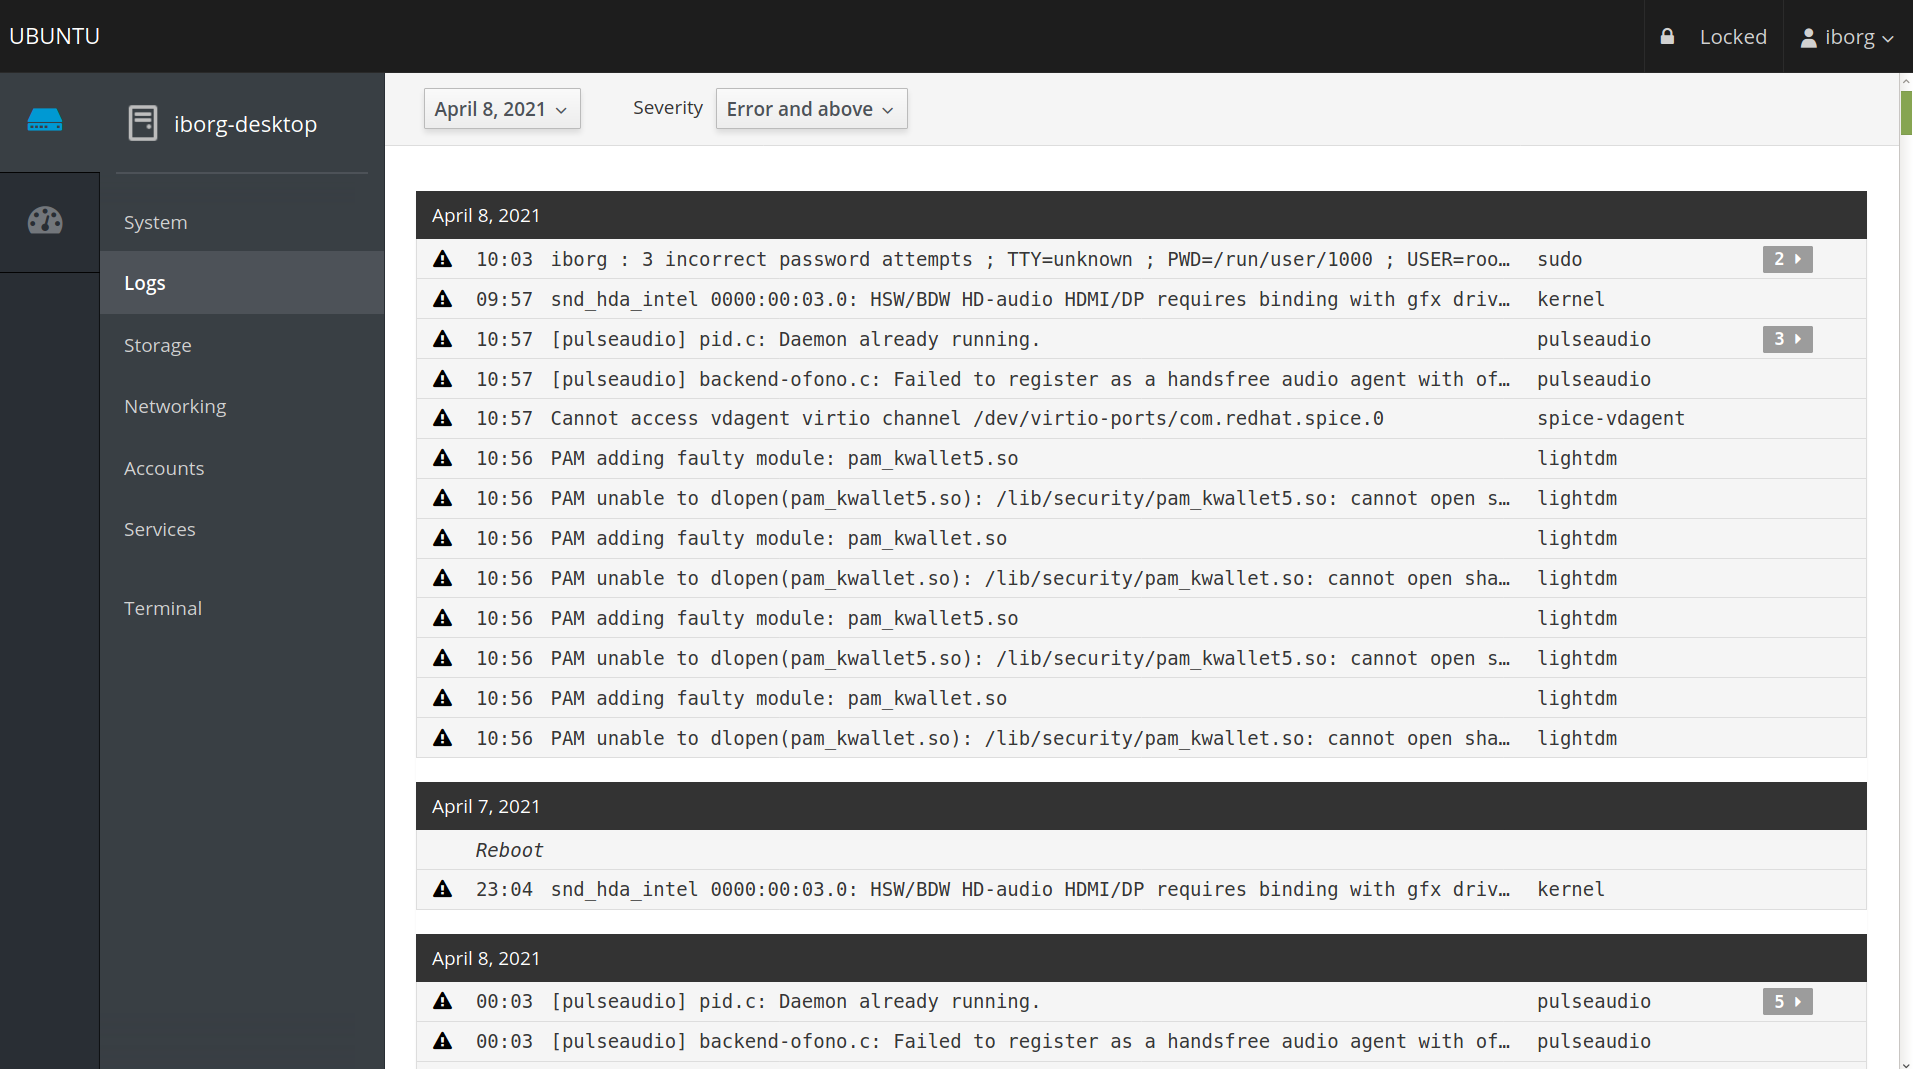
Logs
In the logs section, you can filter the log messages based on the following severities:
- Everything
- Only Emergency
- Alert and above
- Critical and above
- Error and above
- Warning and above
- Notice and above
- Info and above
- Debug and above
By default, it shows you "Error and above" based severity logs. You can also filter the messages based on specific time periods:
- Recent
- Current
- Last 24 hours
- Last 7 days
Storage
In the storage, you can get a concise overview of all your storage stats and they are categorized as:
- Filesystems
- NFS Mounts
- Storage Logs
- RAID Devices
- Drives
- Other Devices
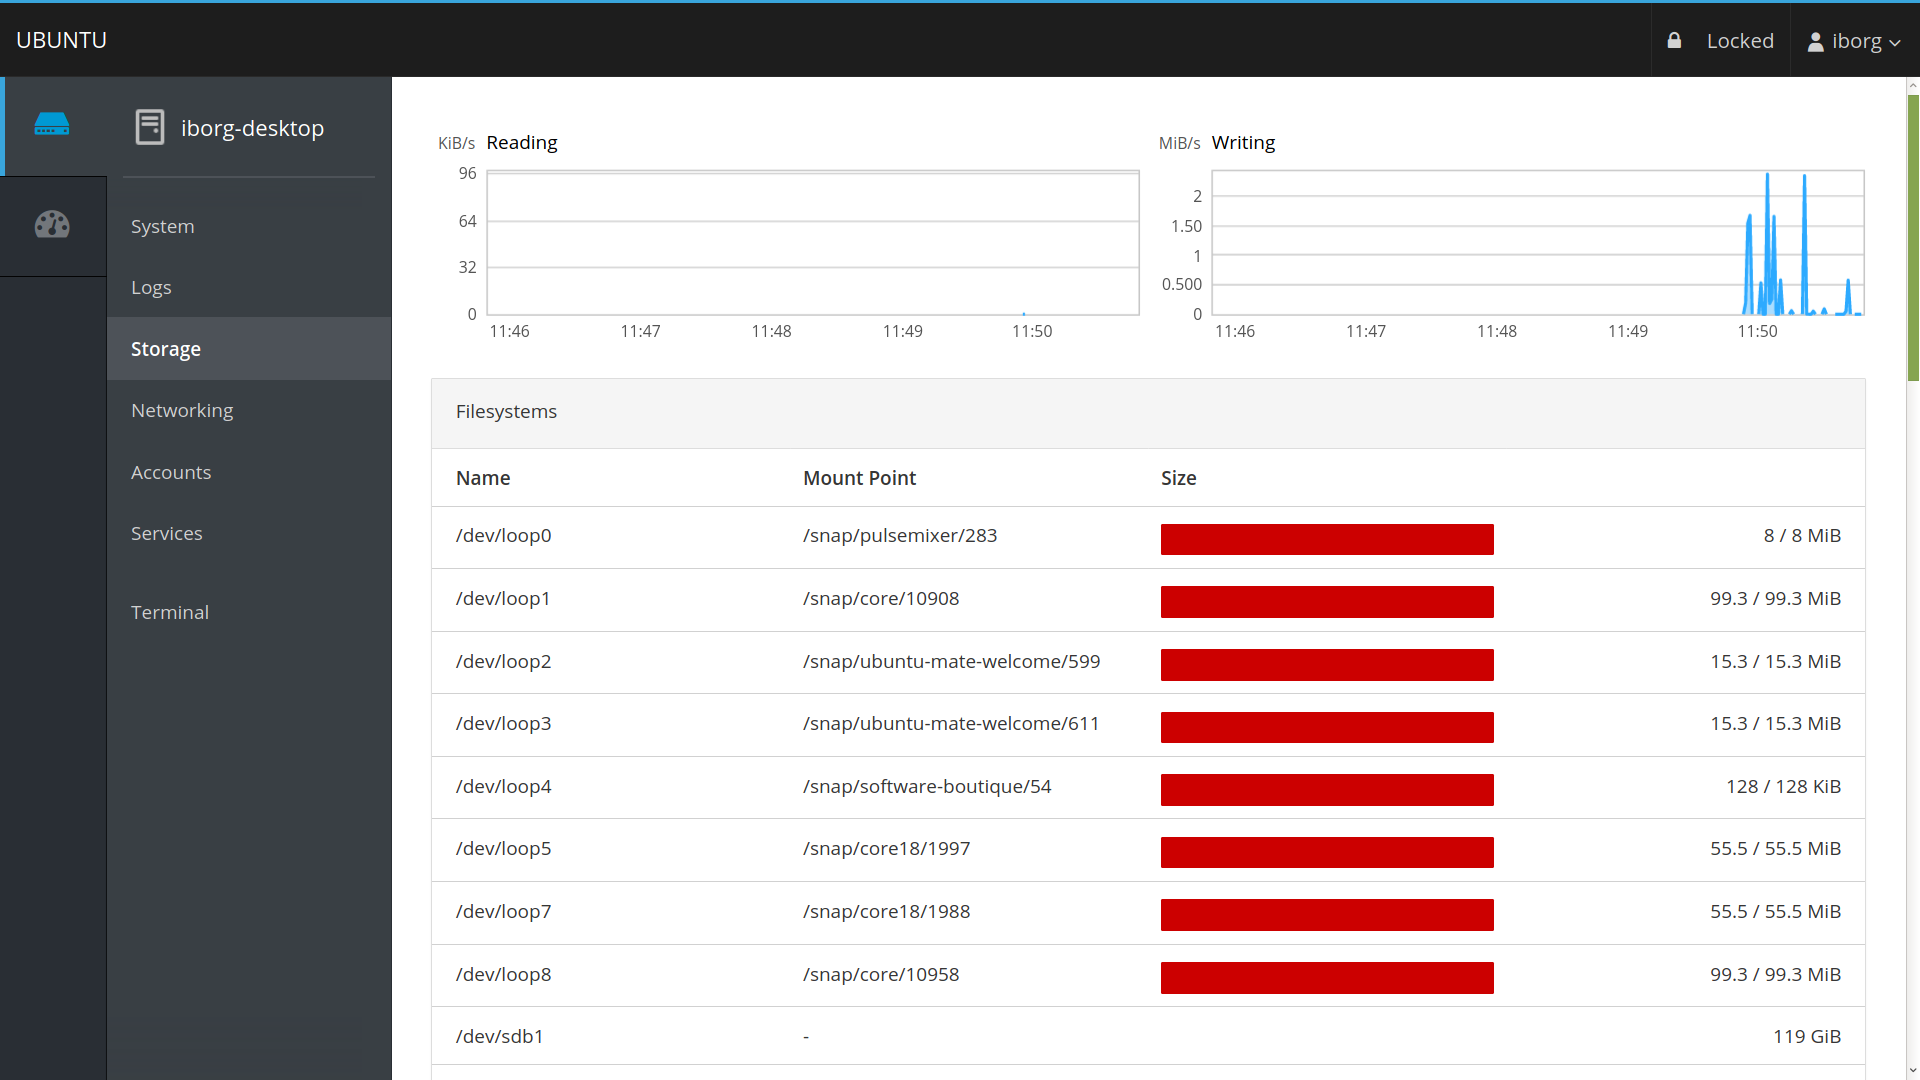
Even though you have a separate log section, it is helpful to have a dedicated log section for storage alone.
Networking
Here you can view all information related to your network interfaces:
- Interfaces
- Networking Logs
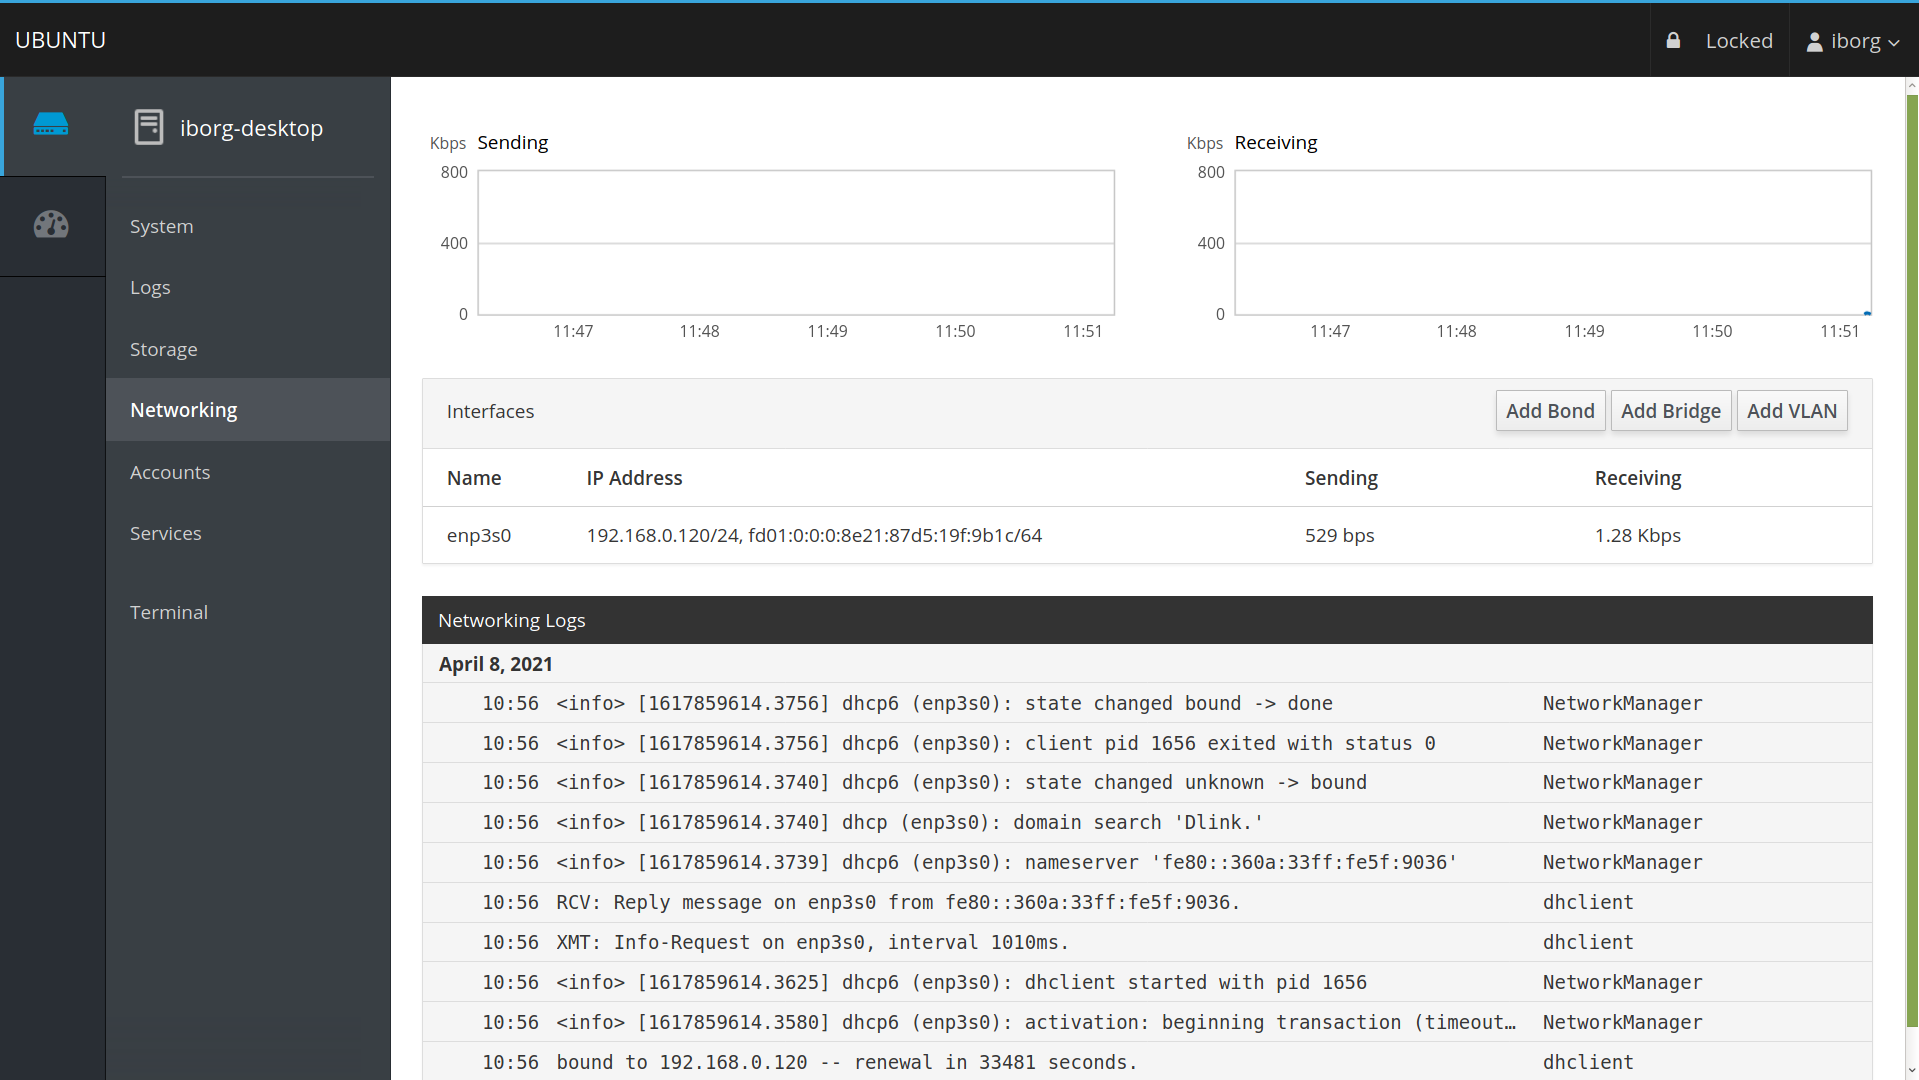
Networking Logs, similar to Storage Logs, enlists all messages related to network stats alone.
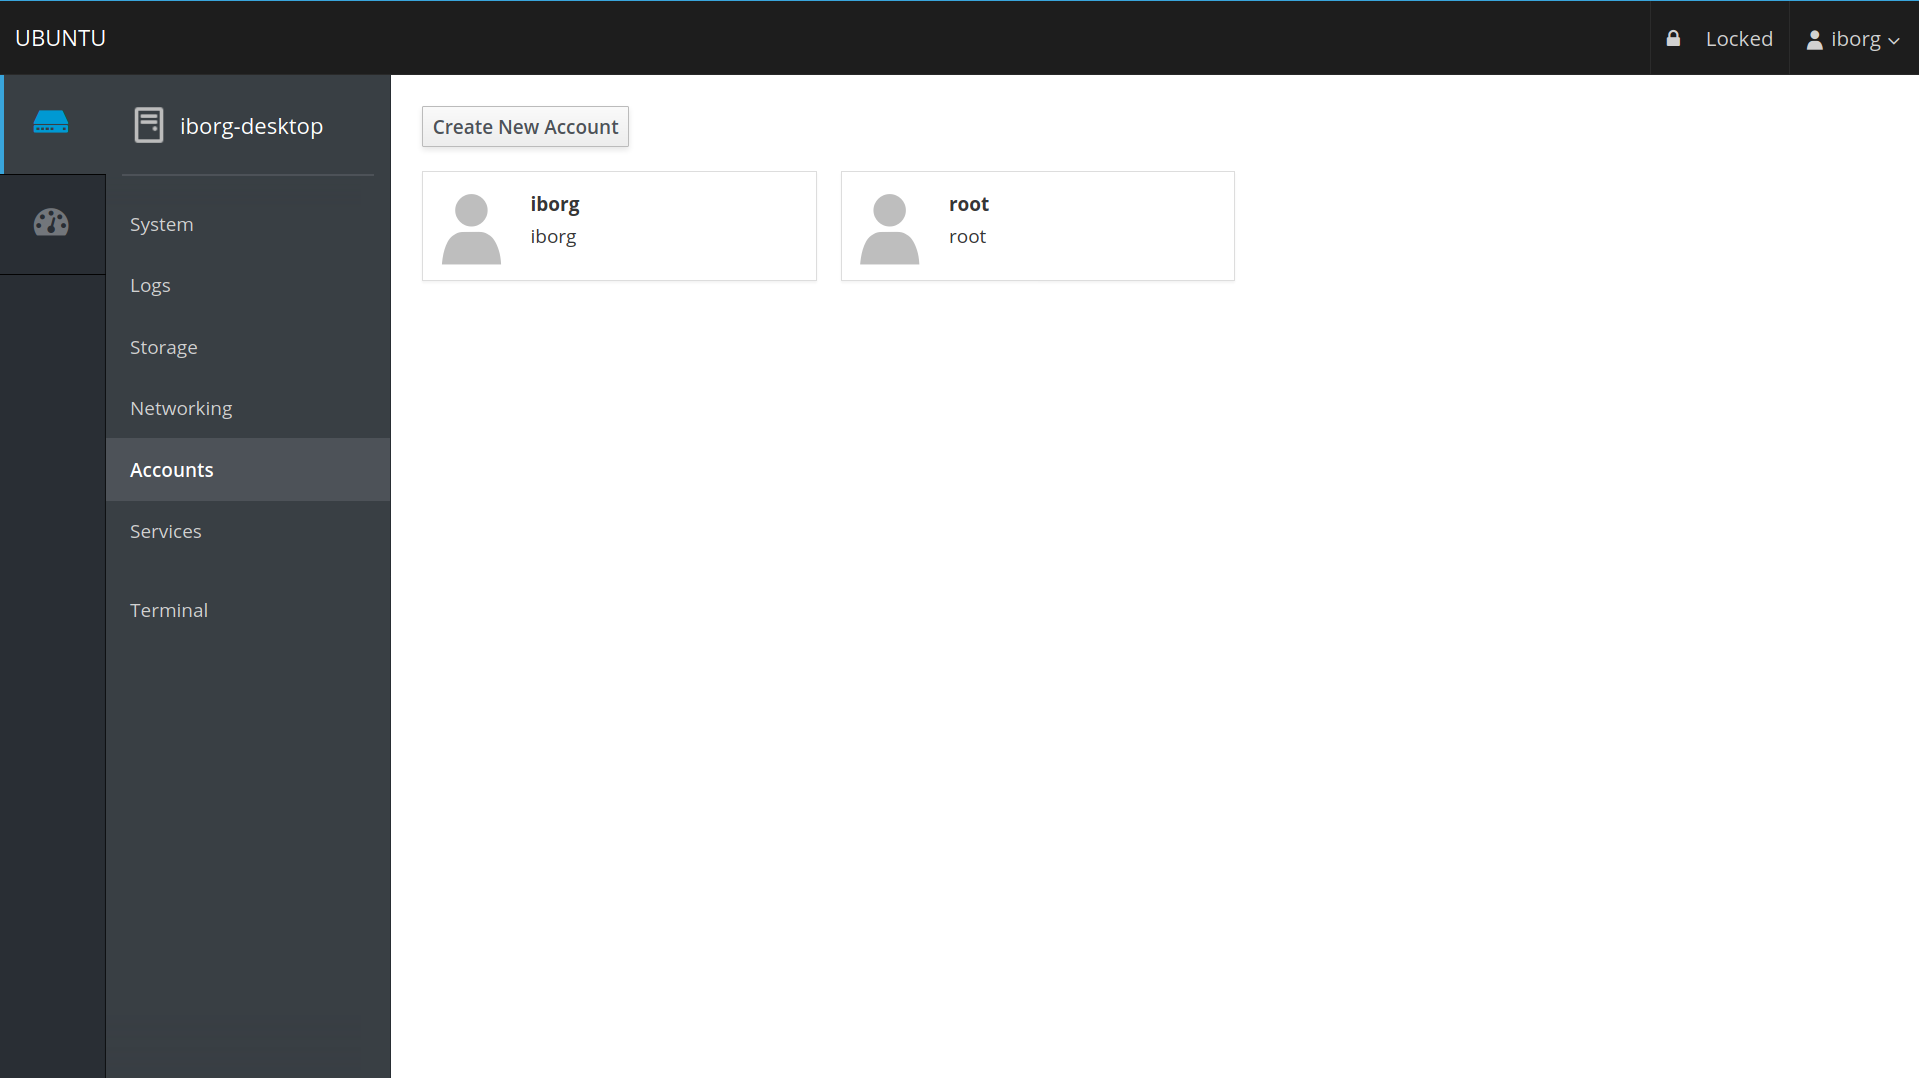
Accounts
This section shows all system users registered on the corresponding Linux server. You can create or delete users through this interface.
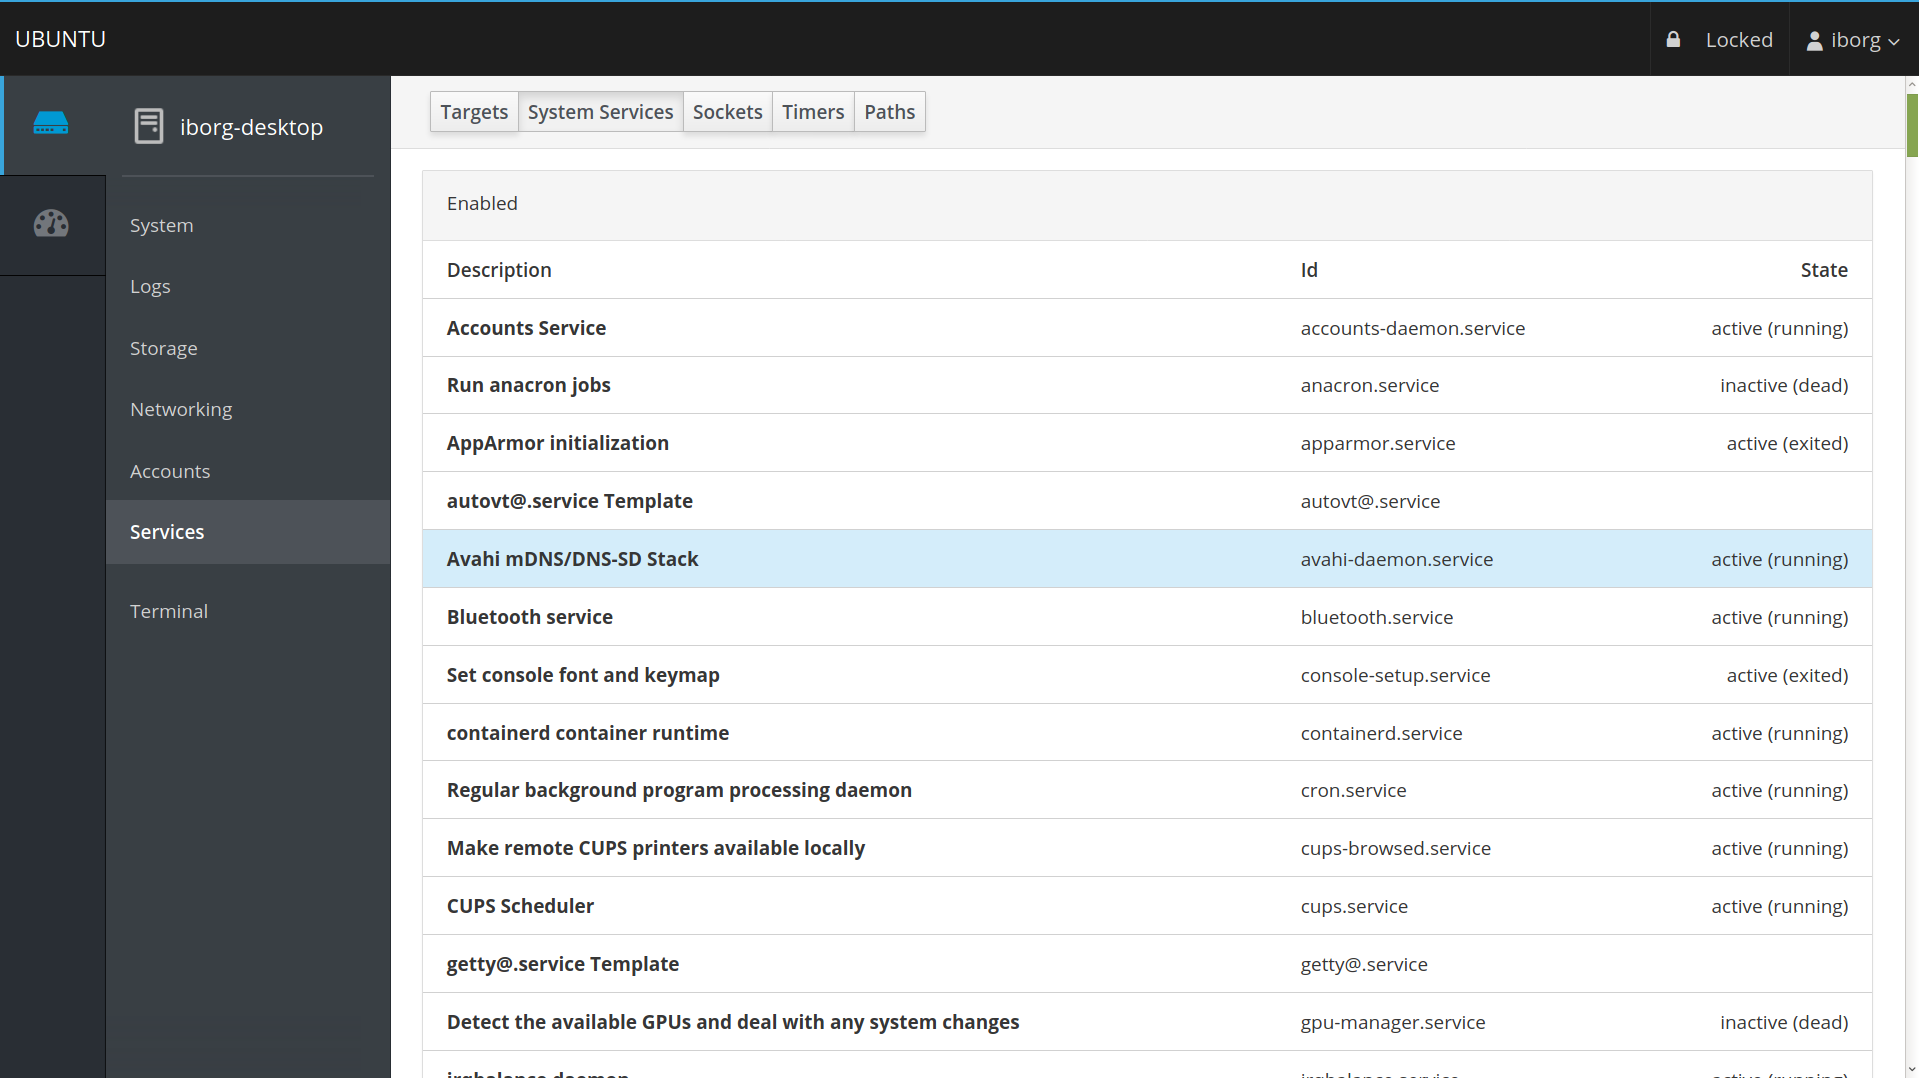
Services
All your server's system services are classified as enabled, disabled and static. You can filter them based on:
- Targets
- System Services
- Sockets
- Timers
- Paths
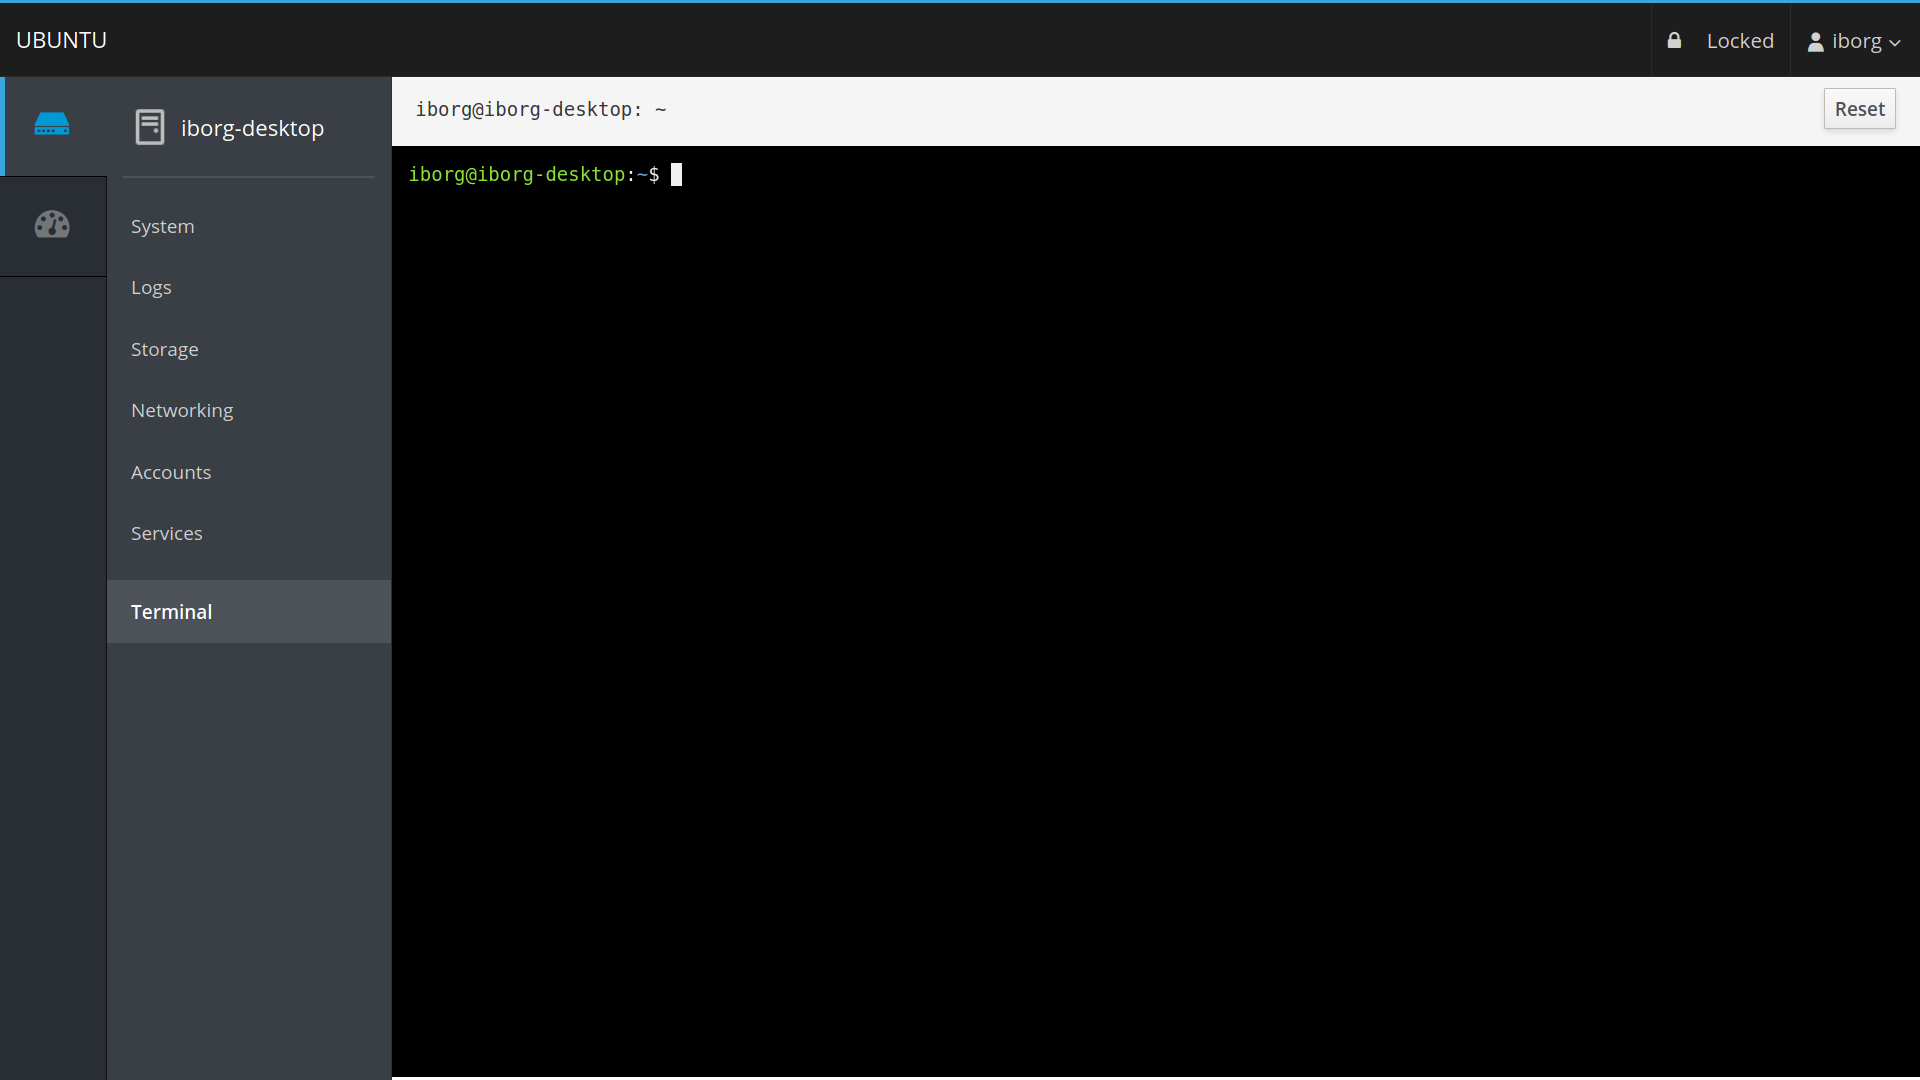
Terminal (yes that too!)
This is my favourite not just because you can run commands in here or geek around. When you need to run important but lengthy commands, it can be extremely annoying to type in the entire thing on the terminal if using a web interface. I've experienced this with the web-based consoles available at Linode, namely Weblish and Glish. You cannot copy and paste any commands in there. But on Cockpit, you definitely can!
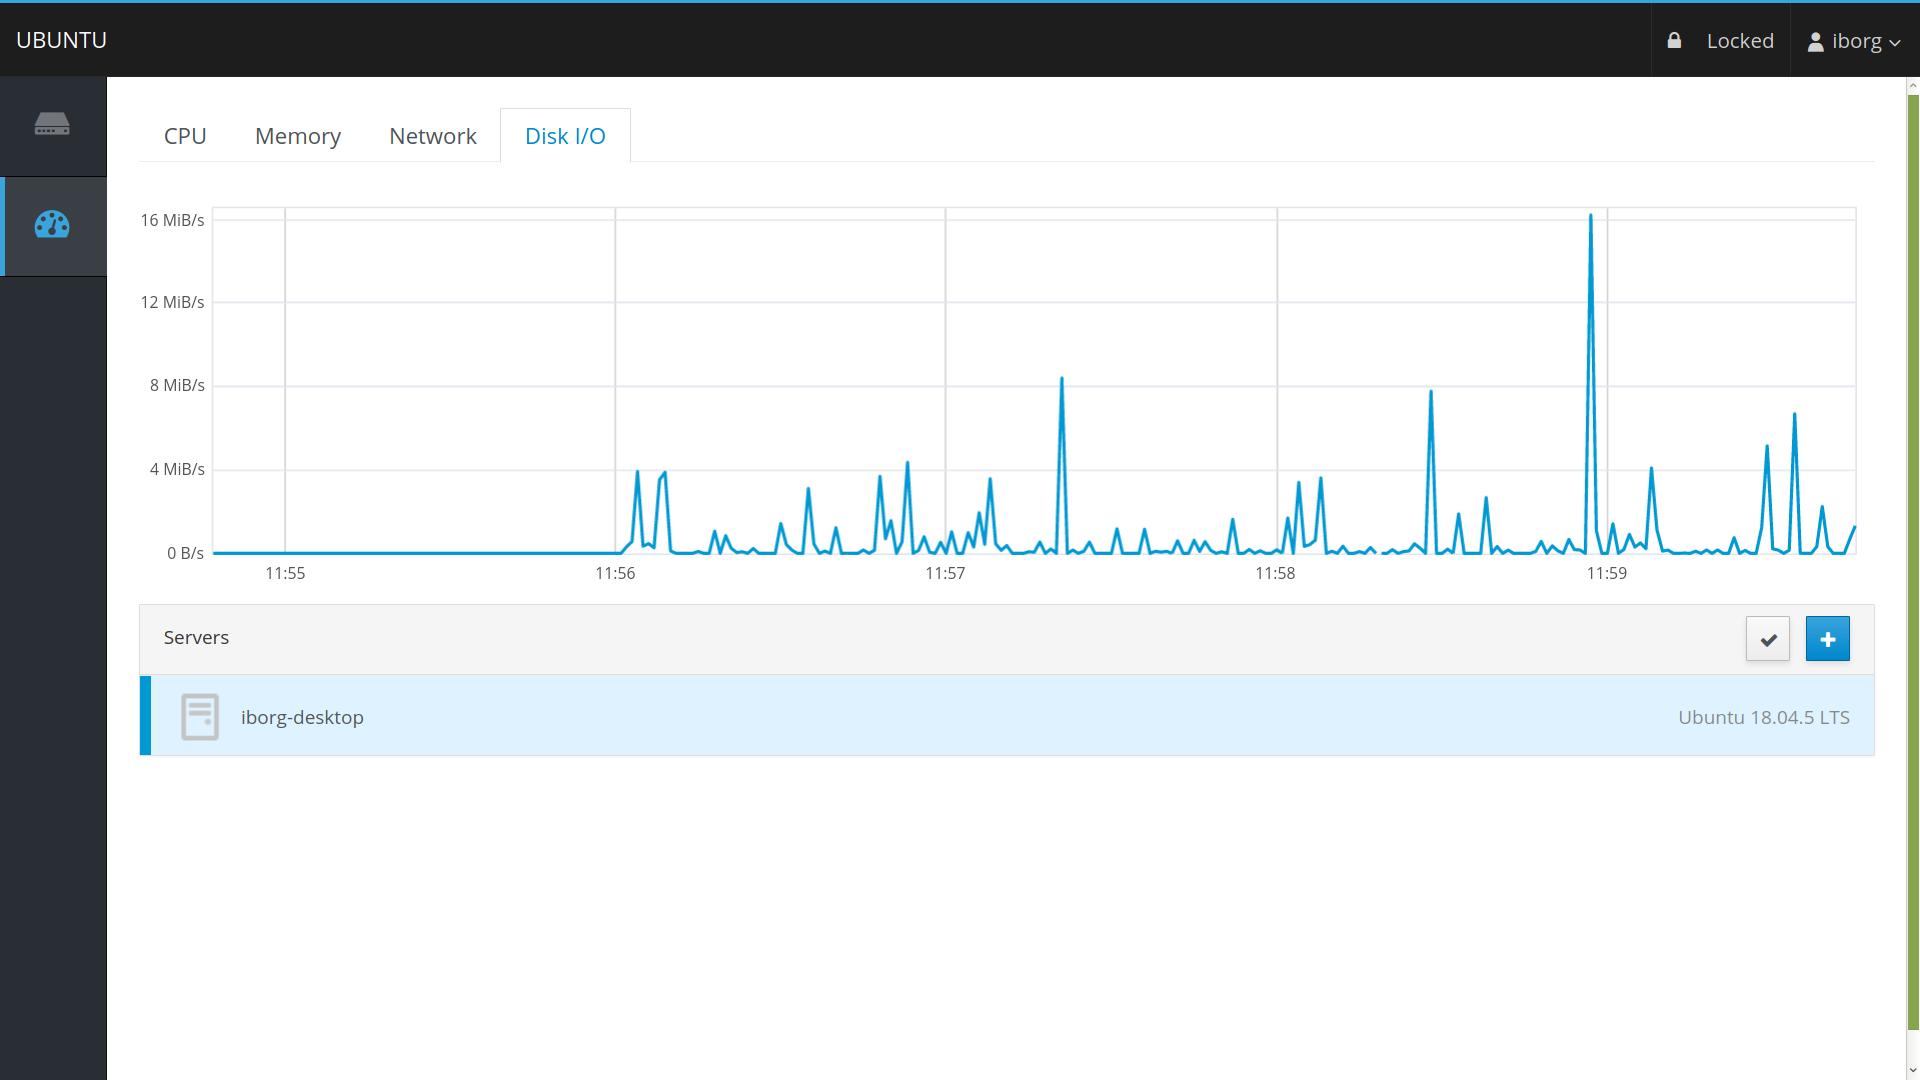
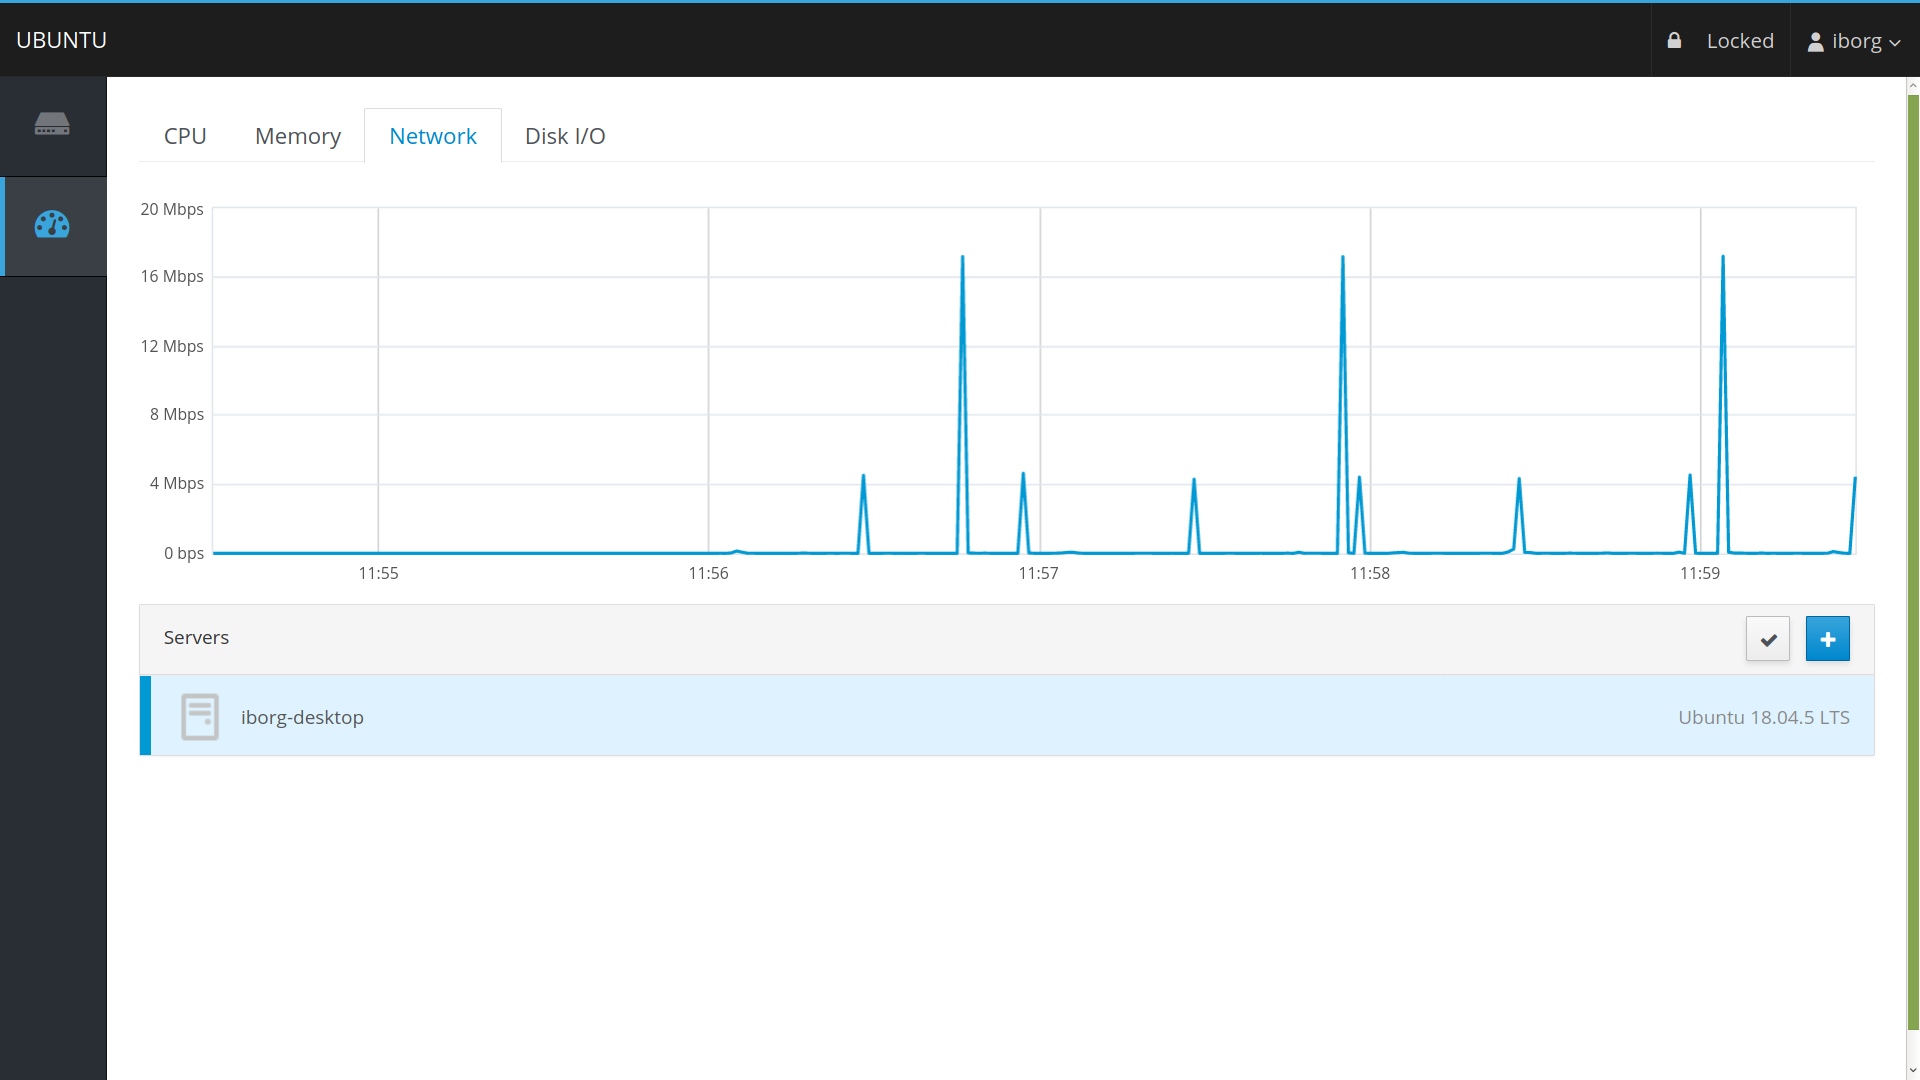
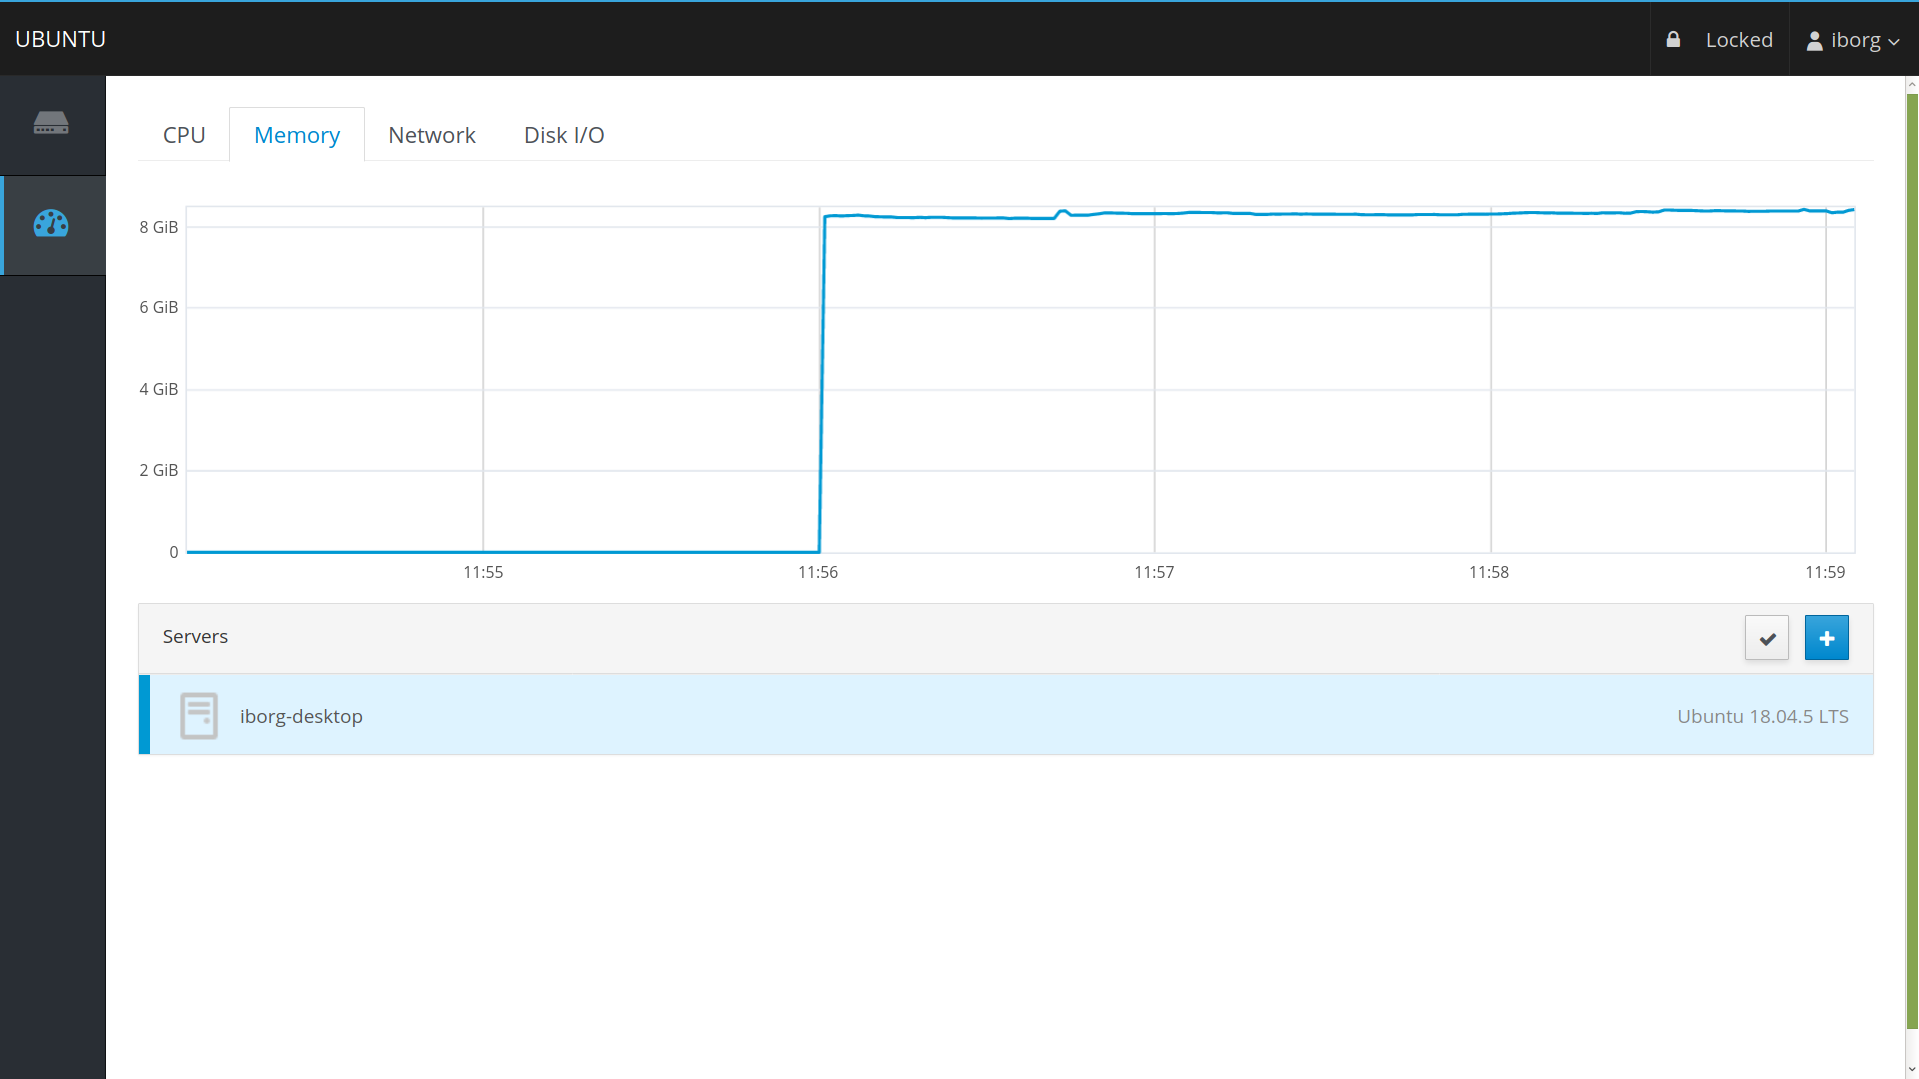
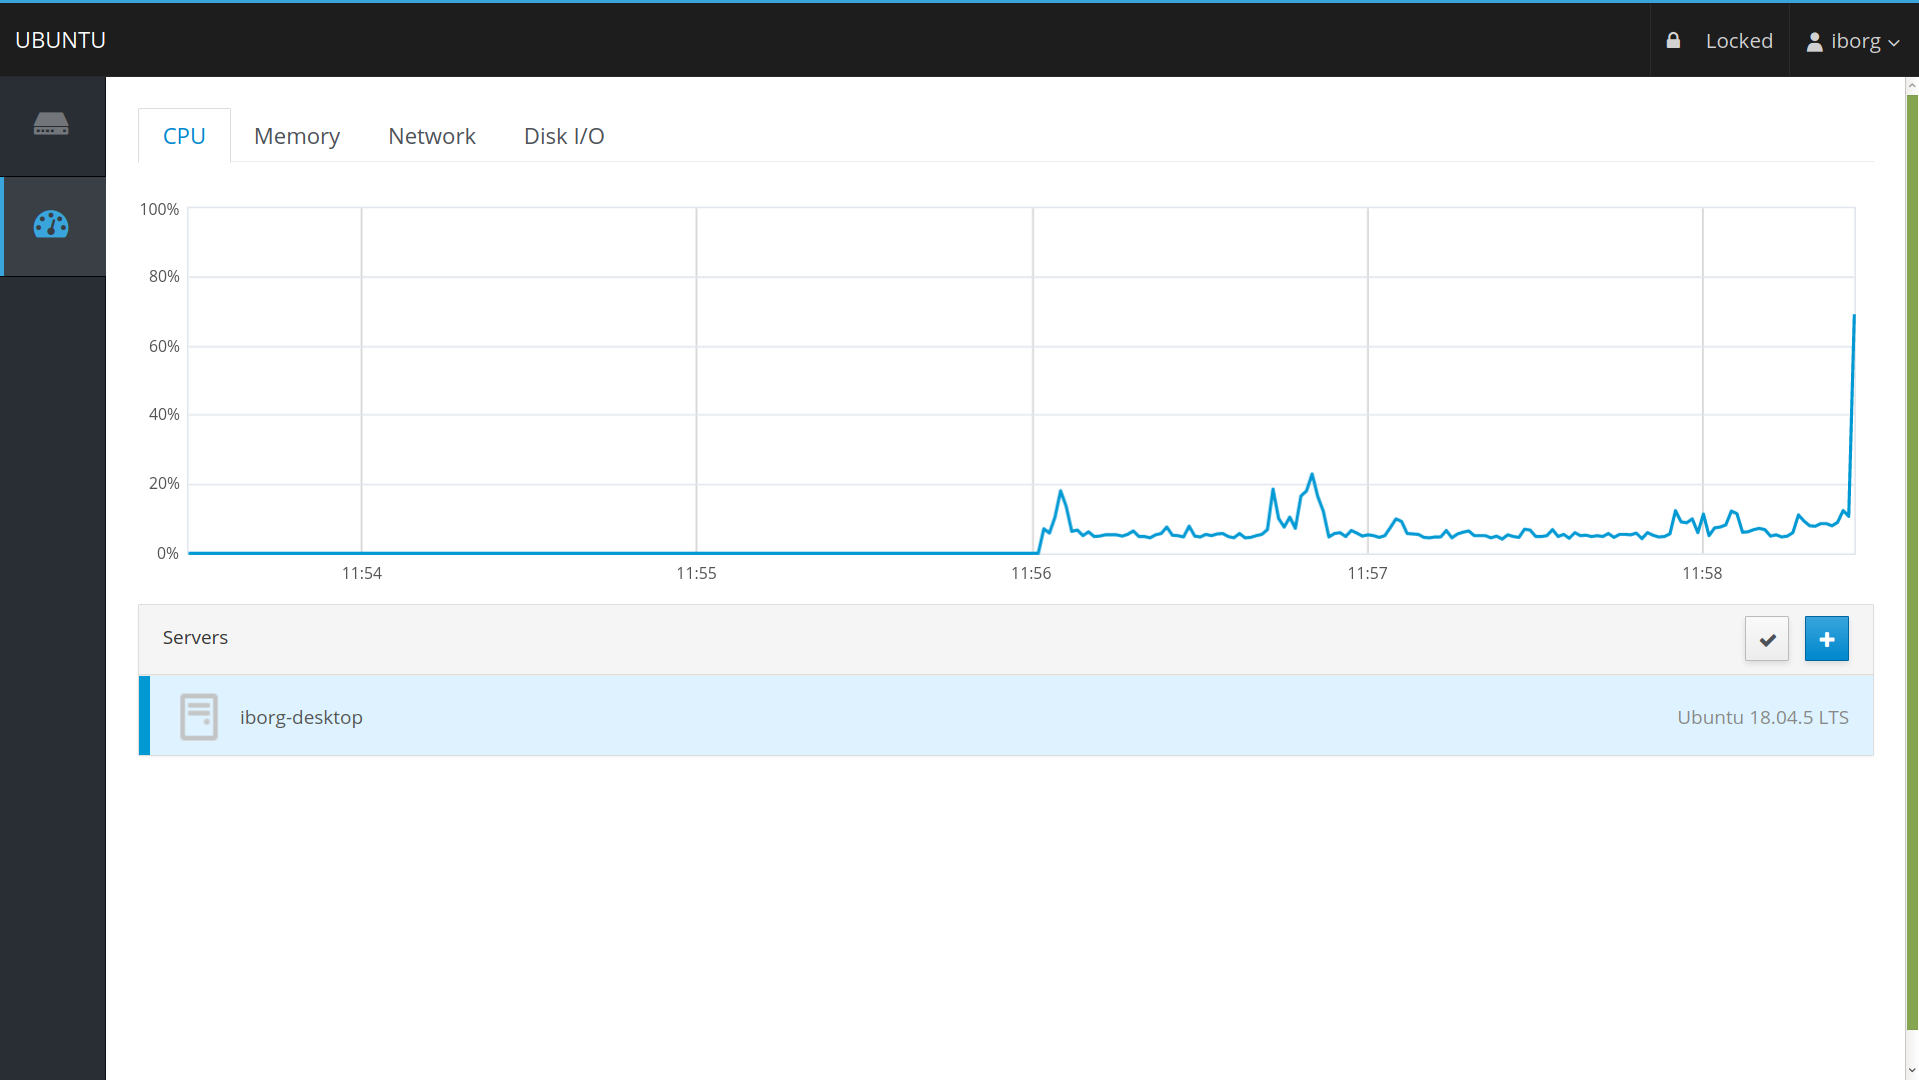
System stats monitoring
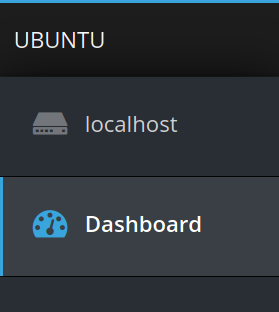
If you want an even simpler overview with the real-time stats, you can head over to the Dashboard instead.
The stats are categorized into four essential tabs: CPU, Memory, Network and Disk I/O.
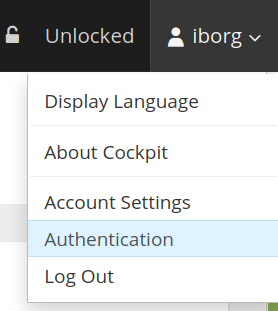
Adding SSH key
On the top right-hand side corner, click on your username followed by "Authentication".
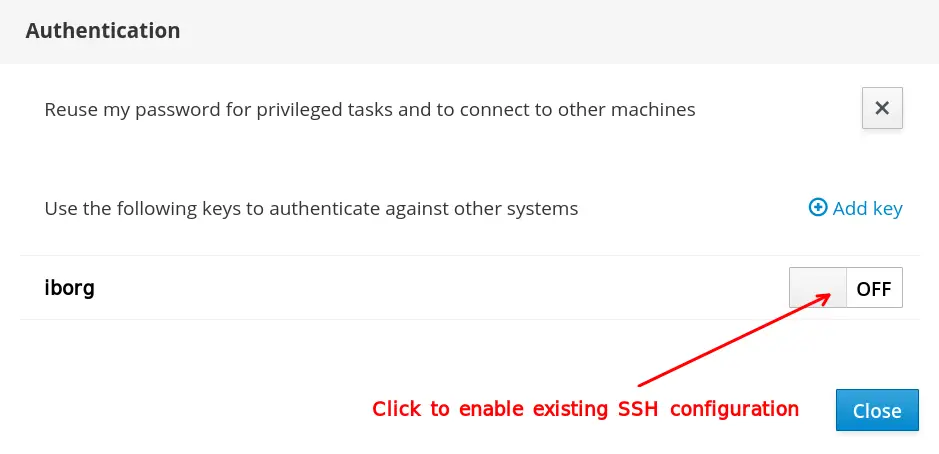
If your SSH key is in its default location, it would be detected automatically. Otherwise, you would need to add it manually and enable it. This is the same SSH configuration that you use via a terminal. If you're using a passphrase for your SSH locally, you must enter that after clicking the button shown below.
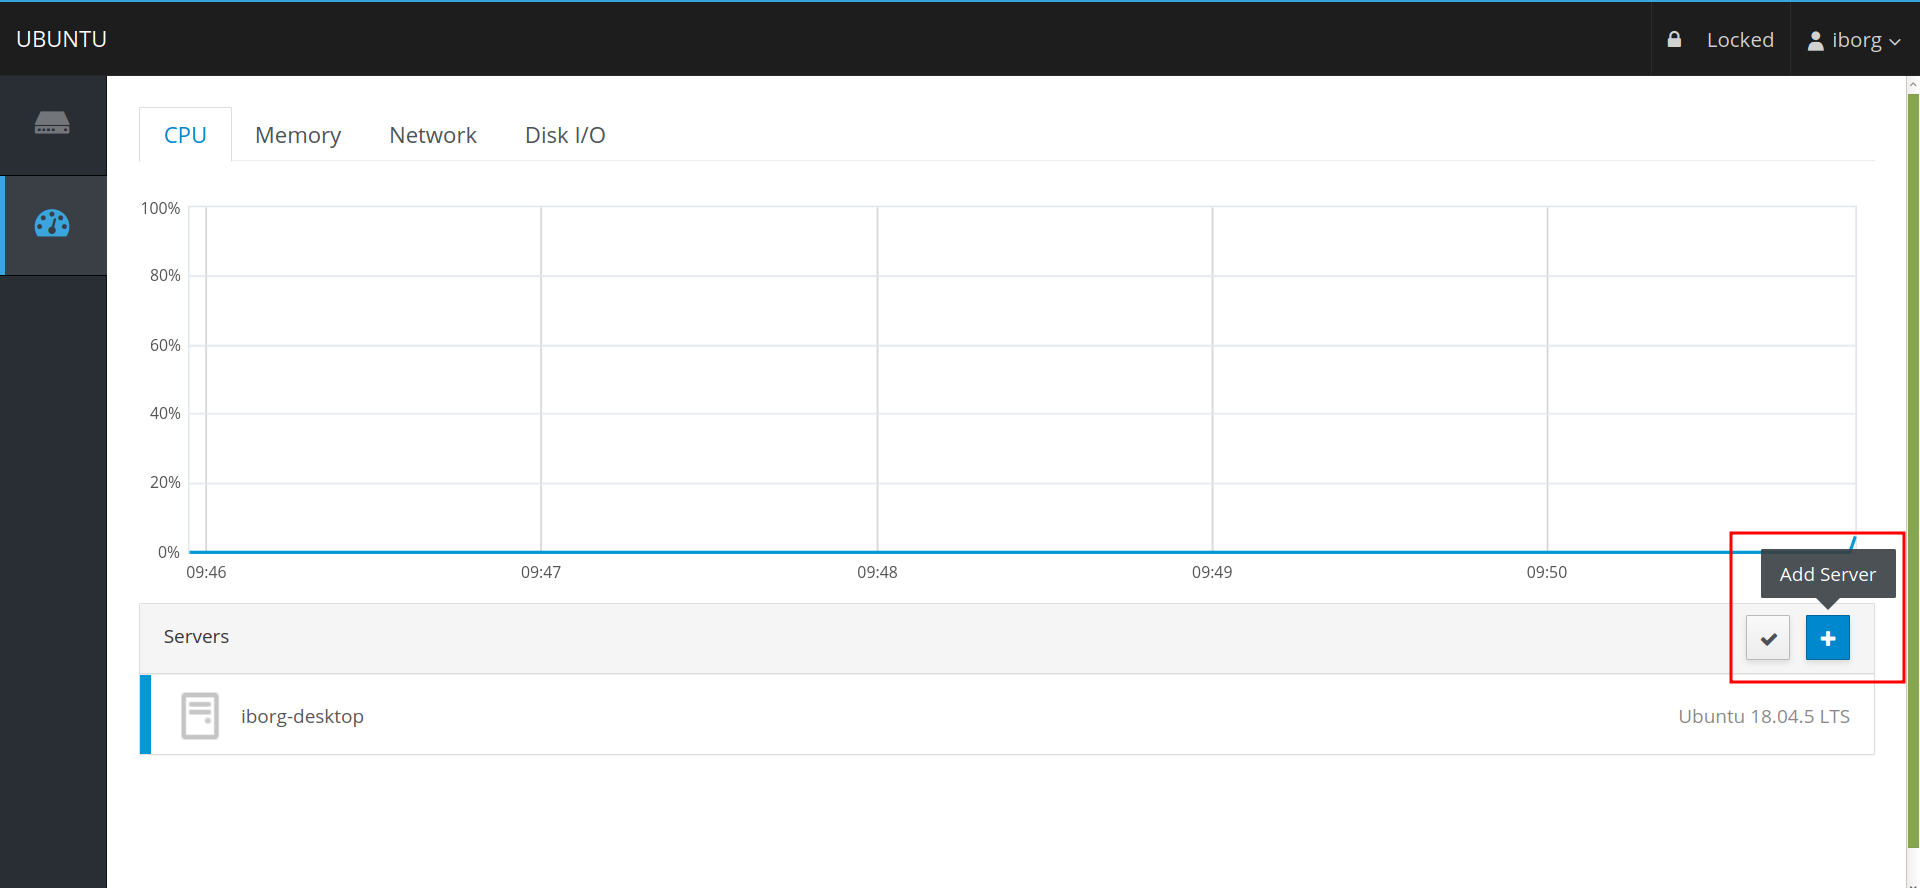
Adding more Linux servers in your Cockpit dashboard
From this simple dashboard, you can add more servers to monitor from a single interface. But to ensure that, you must make sure of the following prerequisites:
- You have logged in with "Reuse my password for privileged tasks" as checked.
- Cockpit is installed on all servers before adding them.
- Your SSH key (presumed as a standard here) is added and enabled beforehand
To add the machine, instead of 9090 as mentioned above, you must use the same SSH port number that you use on your remote server. By default, it is 22.
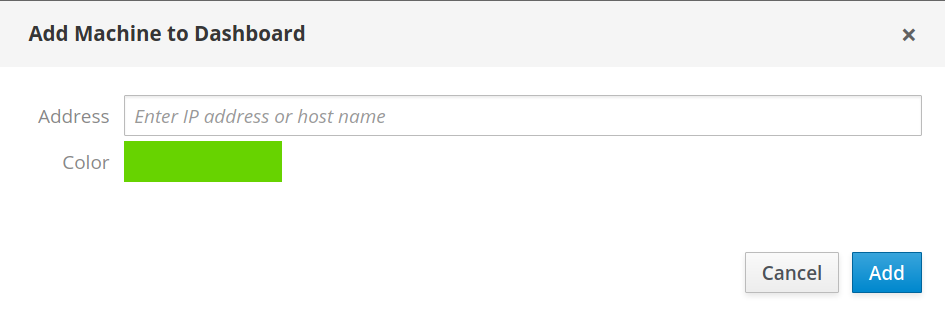
After clicking on "Add", you might get an error like:
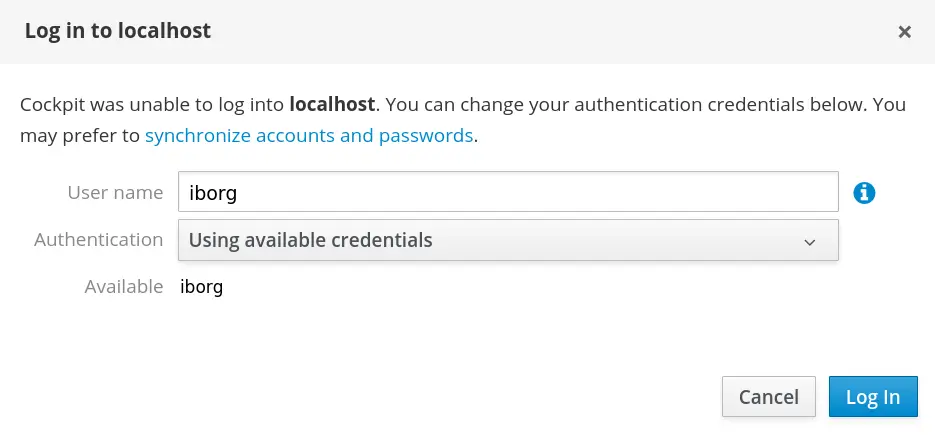
This is because, Cockpit is trying to use the same credentials as your current system with the remote server. On the same error page (as seen in the above image), you can change the username to something that is recognized by your remote server.
Once you do that and click login, your remote server would be added.
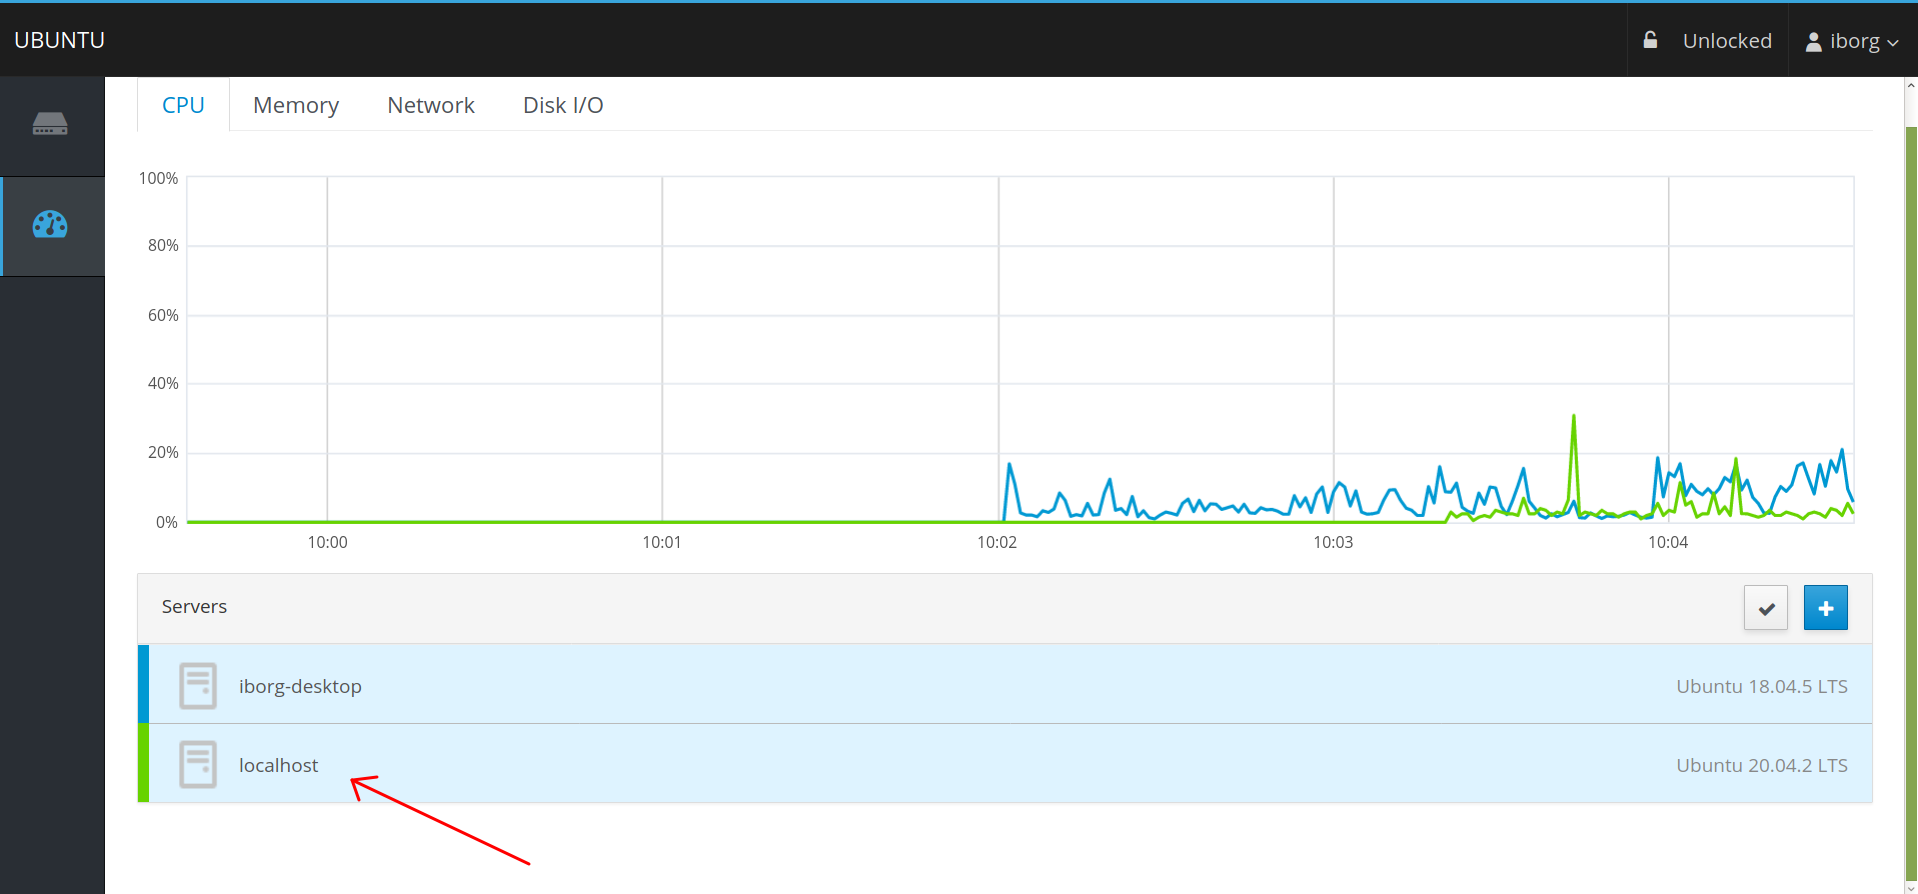
Removing servers from Cockpit
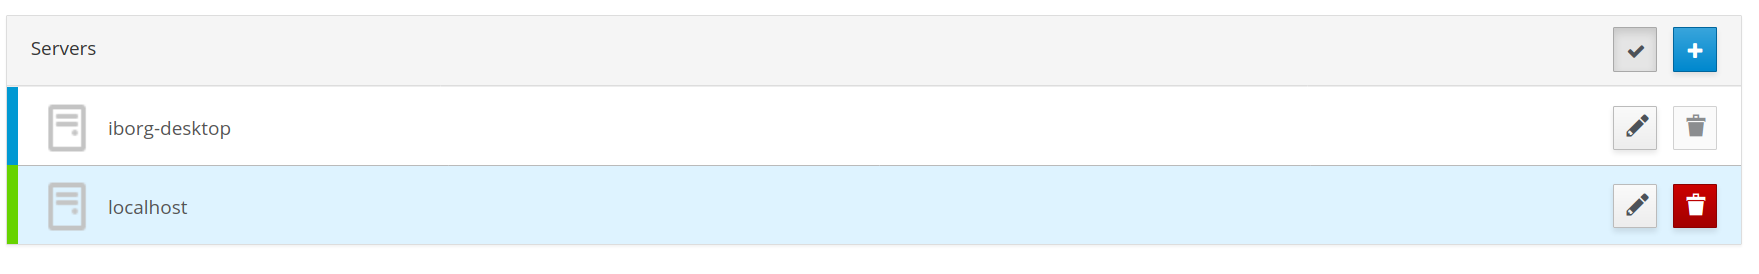
To remove servers already added, you need to click on the "Edit Server" icon:
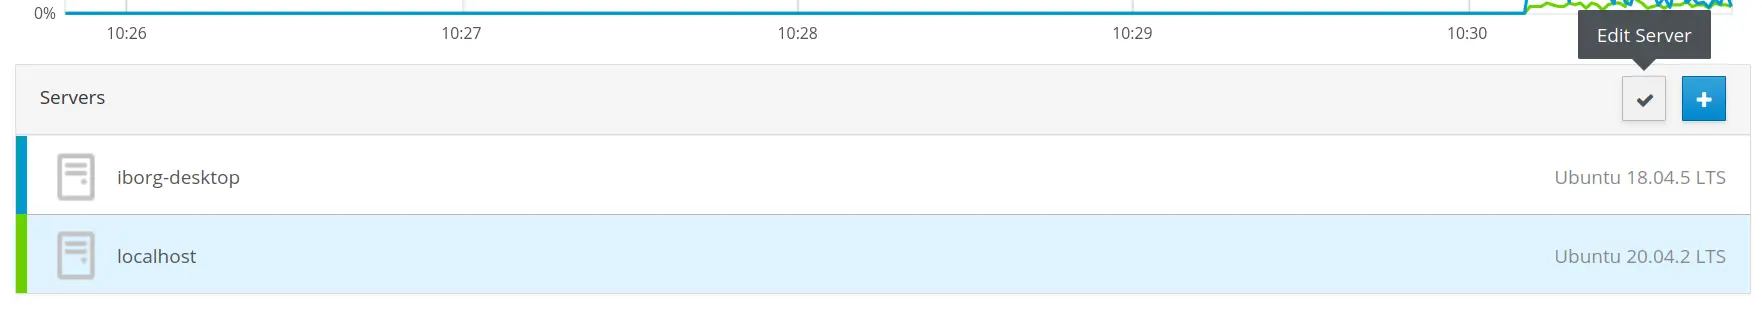
Once clicked, you can remove the added server marked in red. The other one is greyed out because you cannot remove the server you are currently connected to.
Keep in mind that the removed server will be removed from this Cockpit's dashboard. Since Cockpit is still installed on that server, you could use it on port 9090 of the server's IP address. You should uninstall the Cockpit program for the server.
Final thoughts on Cockpit
I did not expect its user interface to be this simple and at the same time be such a resourceful piece of server monitoring software! I fell in love with it as soon as I had a look at its super intuitive dashboard and interface stats! You don't additional server monitoring tools with Cockpit.
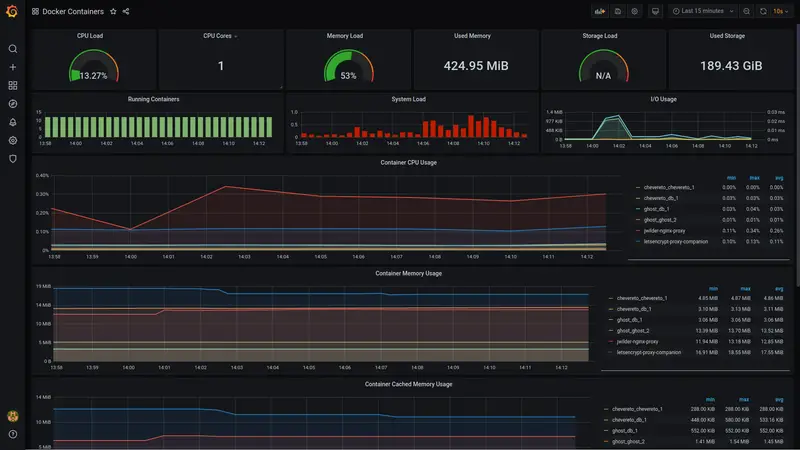
It isn't that the thought hasn't crossed my mind about installing Cockpit as a Docker container. But its design isn't quite ideal for that. The following quote from this GitHub link makes it very clear:
"The way cockpit is designed, it really wants/needs to run on a full machine, not a single-task docker application container."
But if you still want to experiment, check out this unofficial docker image. It also includes a docker-compose configuration for you to start with.
For someone reluctant to command line, Cockpit is quite a handy tool. It is also handy for seasoned sysadmins for having an overview of multiple Linux servers under one dashboard.
If you happen to be a seasoned Cockpit admin, please share any valuable feedback you might have.

DevOps Geek at Linux Handbook | Doctoral Researcher on GPU-based Bioinformatics & author of 'Hands-On GPU Computing with Python' | Strong Believer in the role of Linux & Decentralization in Science