

There are tons of tools available for monitoring your IT infrastructure. This includes monitoring the Linux servers, containers, databases, applications and more.
Services like BetterUptime are convenient and we use it for downtime monitoring.
However, for more granular control, I prefer deploying tools like Prometheus with the beautiful Grafana dashboard.
Recently, I came across a project that gives a complete view of your IT infrastructure within a very short span of time.
Checkmk for monitoring IT infrastructure
With Checkmk, you can effectively harness powerful monitoring capabilities to keep a watchful eye not only on servers, but also networks, clouds, containers, and applications.
Checkmk is available in two main editions. The managed enterprise edition costs money but it has more features.
It also has a free and open source edition called Checkmk Raw Edition (RE).
I am going to show how to deploy and set up Checkmk RE for monitoring your servers.
Setting up Checkmk RE for managing Linux servers
I am going to take you on a walkthrough of Checkmk RE and show how you can install, configure and finally use it. I've followed the official documentation and honestly found it quite more complex to configure compared to the earlier tools I had explored.
Therefore, I decided to focus on making that experience better through this article.
Before I begin, I would like to reiterate that, like Cockpit, installing a Docker version of Checkmk Raw Edition is not quite recommended in general practice.
Install Checkmk RE on the server you want to monitor
You need to have Checkmk RE and the Checkmk agent installed to be able to monitor your server. At this time of review, I have tested version 2.0.0p7.
Download the necessary package
For this tutorial, I'm going to first download Checkmk RE on an Ubuntu 20.04 server:
wget https://download.checkmk.com/checkmk/2.0.0p7/check-mk-raw-2.0.0p7_0.focal_amd64.deb
Verify the Checkmk package
Install dpkg-sig for package verification. Also make sure gpg is installed.
sudo apt -y install dpkg-sig gpg
After that is done, obtain the gpg key:
avimanyu@localhost:~$ gpg --keyserver keyserver.ubuntu.com --recv-keys 434DAC48C4503261
gpg: directory '/home/avimanyu/.gnupg' created
gpg: keybox '/home/avimanyu/.gnupg/pubring.kbx' created
gpg: /home/avimanyu/.gnupg/trustdb.gpg: trustdb created
gpg: key 434DAC48C4503261: public key "Check_MK Software Release Signing Key (2018) <[email protected]>" imported
gpg: Total number processed: 1
gpg:               imported: 1
avimanyu@localhost:~$ gpg --armor --export 434DAC48C4503261 > Check_MK-pubkey.gpg
Add the newly obtained public key:
avimanyu@localhost:~$ sudo apt-key add Check_MK-pubkey.gpg
OK
Now you can verify the Checkmk package you just downloaded:
avimanyu@localhost:~$ dpkg-sig --verify check-mk-raw-2.0.0p7_0.focal_amd64.deb
Processing check-mk-raw-2.0.0p7_0.focal_amd64.deb...
GOODSIG _gpgbuilder B1E7106575B723F00611C612434DAC48C4503261 1625600497
GOODSIG indicates successful verification. So let us now proceed with the installation.
Install Checkmk Raw Edition
You can use apt to directly install the recently downloaded package:
sudo apt -y install ~/check-mk-raw-2.0.0p7_0.focal_amd64.deb
Just to be sure, for the sake of it, ensure the apache2 service is active and that port 80(used by Apache) is not already being used by some other service.
avimanyu@localhost:~$ systemctl status apache2
● apache2.service - The Apache HTTP Server
     Loaded: loaded (/lib/systemd/system/apache2.service; enabled; vendor preset: enabled)
     Active: active (running) since Wed 2021-07-14 17:30:18 UTC; 6s ago
       Docs: https://httpd.apache.org/docs/2.4/
    Process: 46288 ExecStart=/usr/sbin/apachectl start (code=exited, status=0/SUCCESS)
   Main PID: 46309 (apache2)
      Tasks: 55 (limit: 4617)
     Memory: 7.1M
     CGroup: /system.slice/apache2.service
             ├─46309 /usr/sbin/apache2 -k start
             ├─46310 /usr/sbin/apache2 -k start
             └─46311 /usr/sbin/apache2 -k start
Create your initial web user interface(UI) for first time access
Before you begin monitoring, you must first create your web UI with Open Monitoring Distribution (OMD).


Here, I set the new site name as mysite:
avimanyu@localhost:~$ sudo omd create mysite
Adding /opt/omd/sites/mysite/tmp to /etc/fstab.
Creating temporary filesystem /omd/sites/mysite/tmp...OK
Updating core configuration...
Generating configuration for core (type nagios)...Precompiling host checks...OK
OK
Restarting Apache...OK
Created new site mysite with version 2.0.0p7.cre.

  The site can be started with omd start mysite.
  The default web UI is available at http://localhost/mysite/

  The admin user for the web applications is cmkadmin with password: KgjKy6wpR
  For command line administration of the site, log in with 'omd su mysite'.
  After logging in, you can change the password for cmkadmin with 'htpasswd etc/htpasswd cmkadmin'.
Once that is done, you'll receive important access credentials along-with some helpful instructions to get started with your new UI. I'd recommend saving the output in a separate document for safe-keeping.
If you have physical access to the server, you can use localhost in the web browser like this.
localhost/mysite
In either case, you can access the setup with your server's public IP address. For example, if its IP address is 1.2.3.4, your access URL would be:
1.2.3.4/mysite
In case it has a domain name (say checkmk.domain.com), use:
checkmk.domain.com/mysite
Following that, you should see a login interface like this:
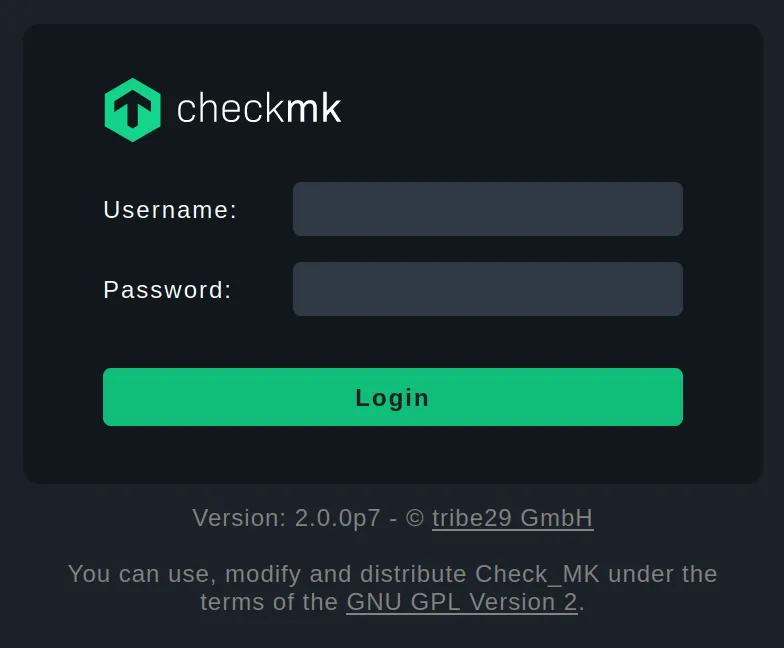
Using the credentials obtained after creating mysite, log into Checkmk. The default admin name as you might have noted, is cmkadmin.
Install Checkmk Agent
To be able to add hosts (servers) you must now install the Checkmk Agent via a package installation. The package download URL can be obtained by ensuring the following steps:
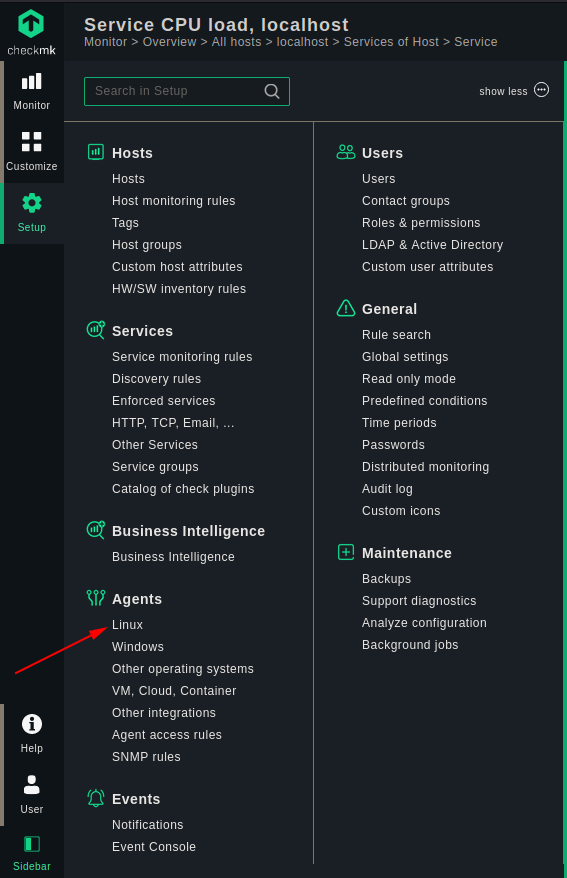
Navigate to Setup and choose Linux under the Agents submenu:
Locate the Debian package(since I'm using Ubuntu):
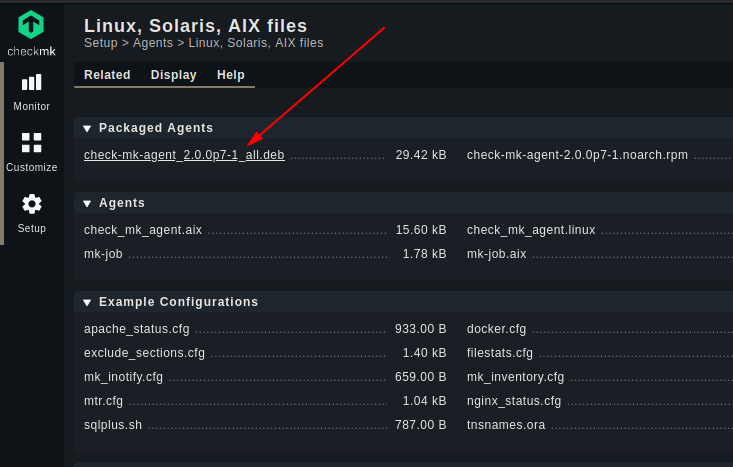
Right click and copy the URL on your browser(Firefox in this case):
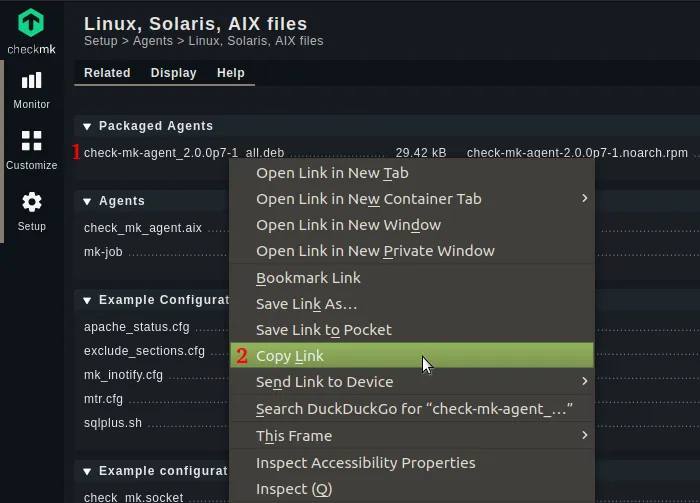
Once you copy the URL, download it on the server with wget. Supposing the IP is 1.2.3.4, the corresponding command would be:
wget http://1.2.3.4/mysite/check_mk/agents/check-mk-agent_2.0.0p7-1_all.deb
Once the download is complete, install the agent package:
sudo apt -y install ~/check-mk-agent_2.0.0p7-1_all.deb
Now you are ready to add servers as hosts for monitoring activities on Checkmk.
Preparing Checkmk for monitoring your server(s)
Begin adding the host server based on each of the steps shared below.
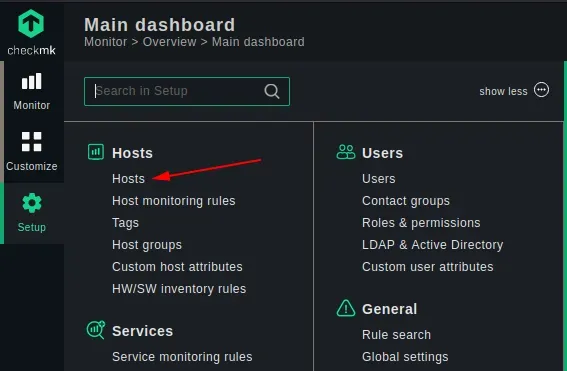
Start at Setup > Hosts > Hosts.
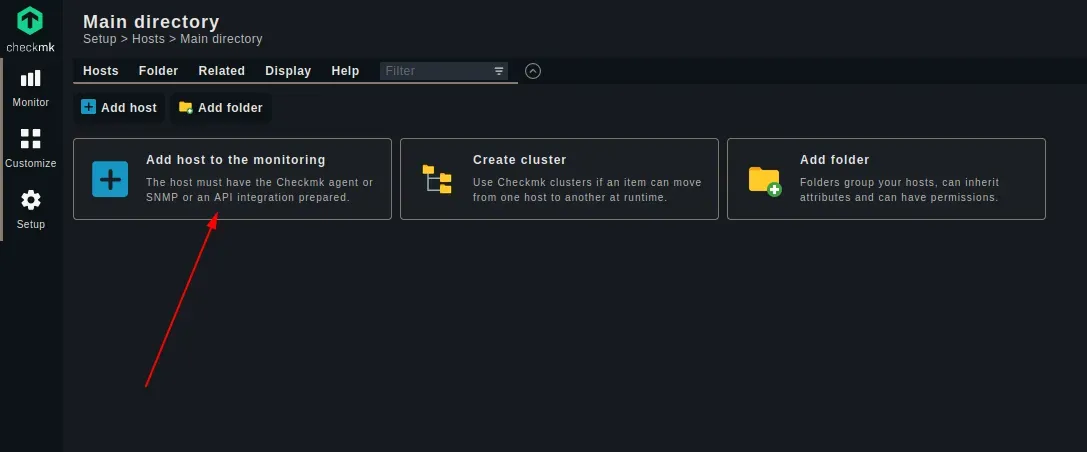
Select “Add host to the monitoring”(repeat this step to add more servers).
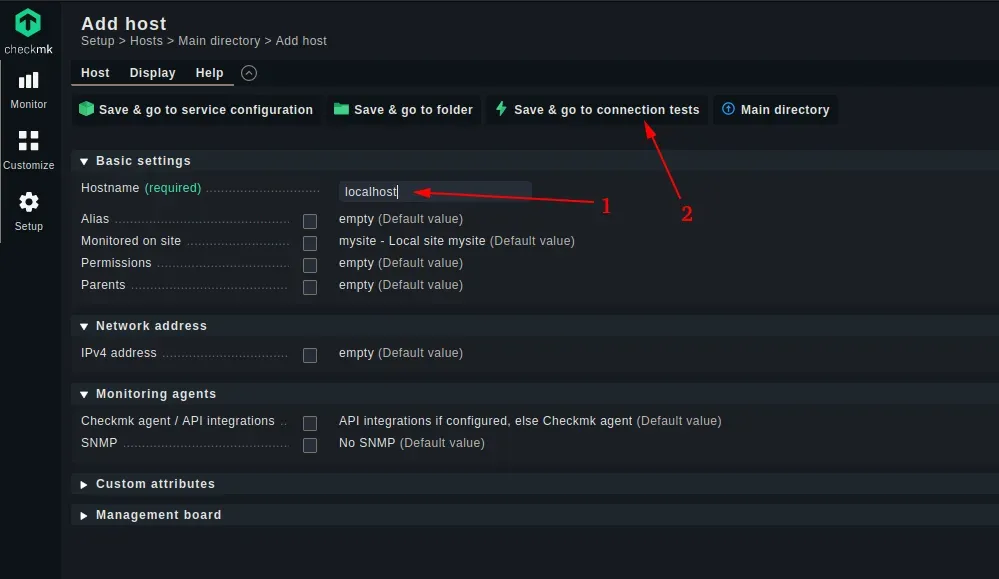
Enter the Hostname as localhost and select “Save & go to connection tests”(Use server's public IP or domain name as Hostname for remote servers).
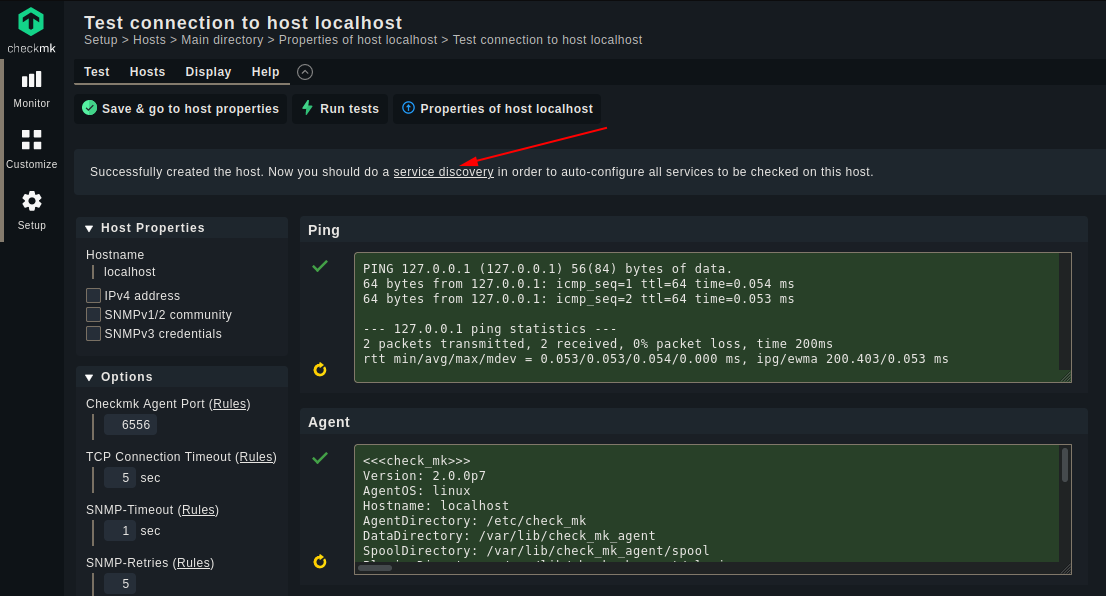
Wait for the connection tests to complete.
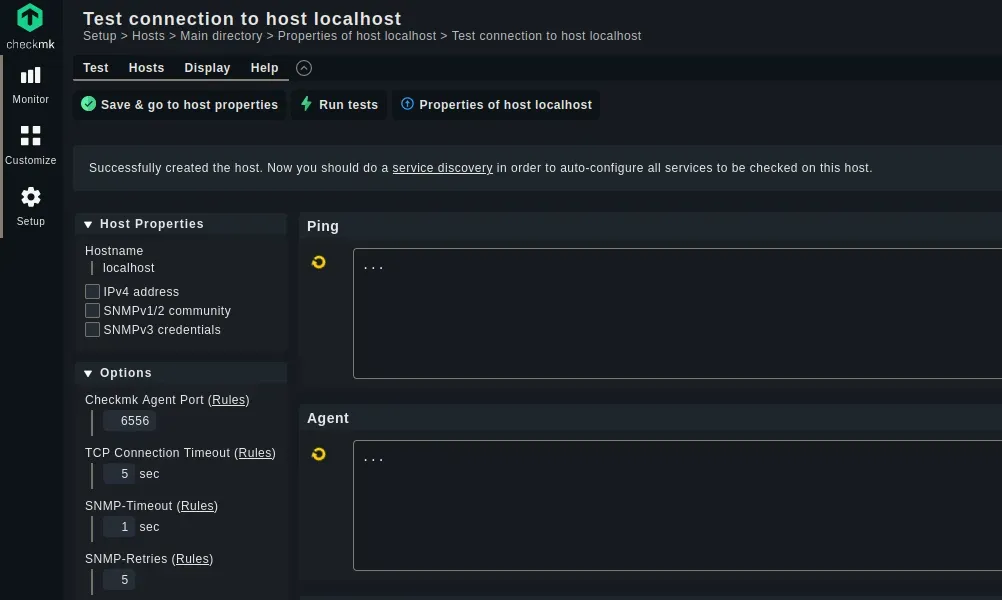
Once the tests get completed, click on “service discovery”.
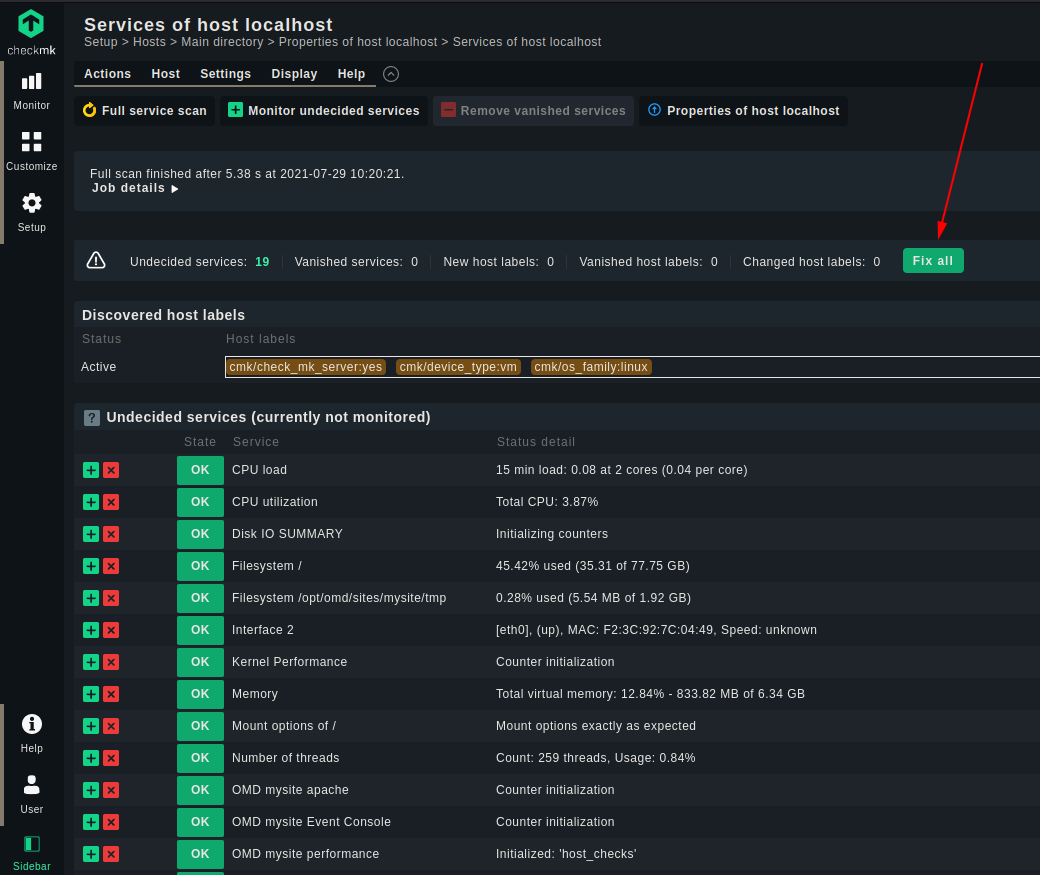
Select “Fix all” to diagnose “Undecided services”.
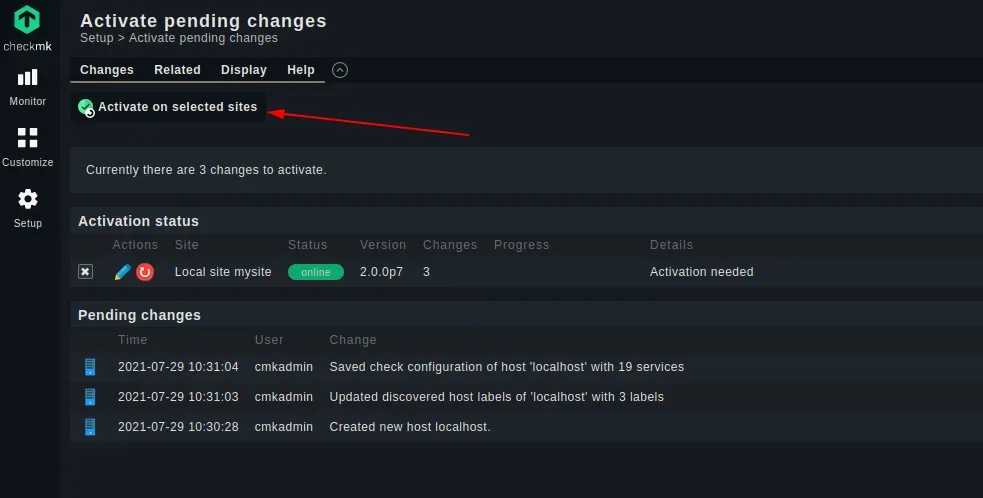
Now click on “3 changes” located on the top right with the yellow circle having an exclamation mark. The number of changes may vary from user to user.
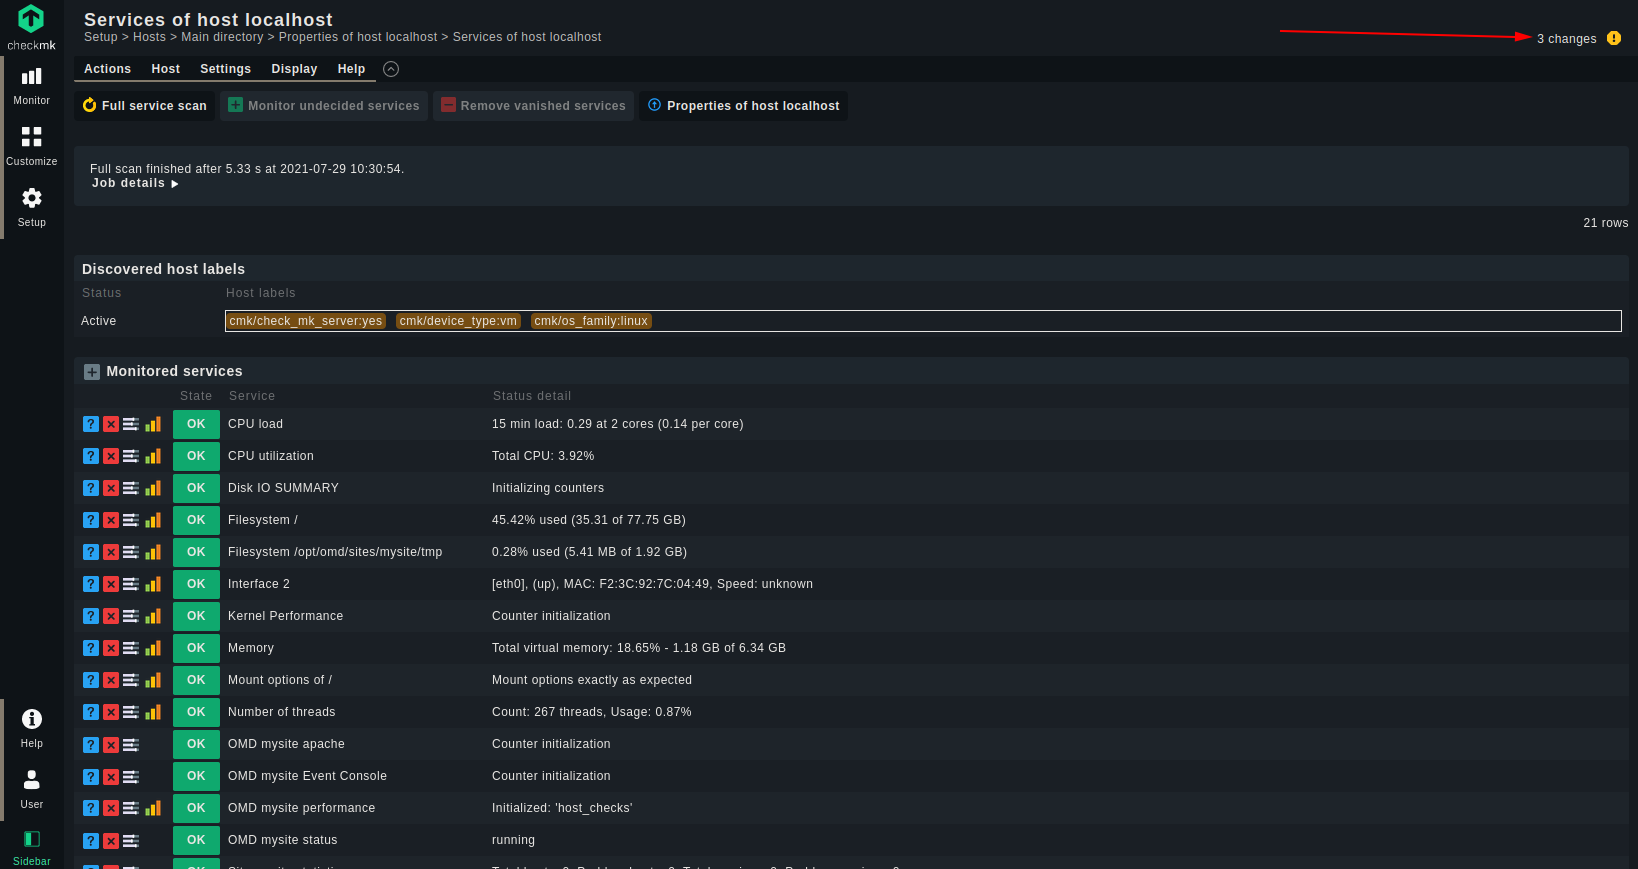
Select “Activate on selected sites”.
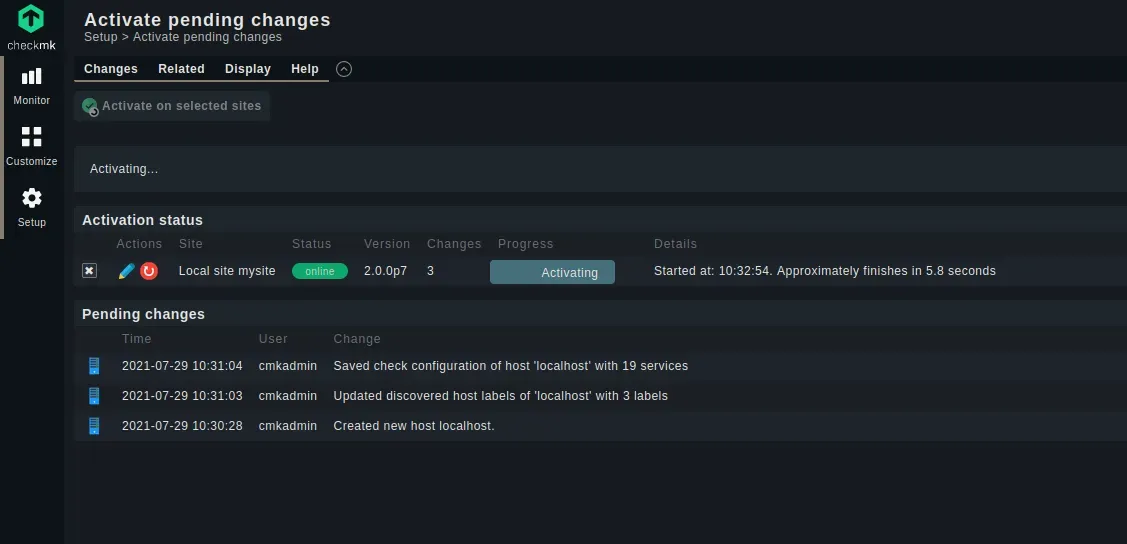
Wait for activation to complete.
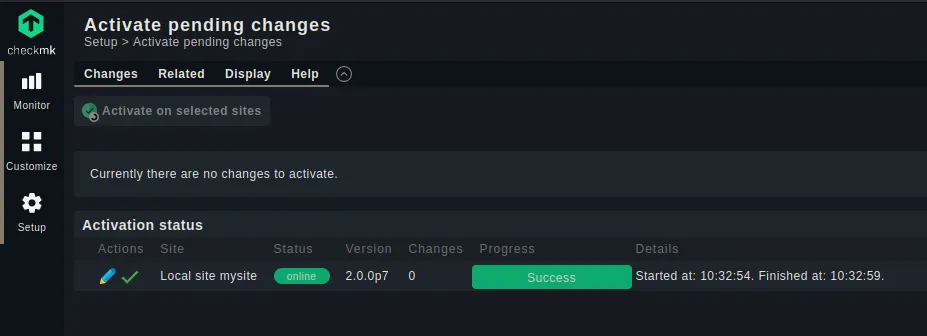
After activation is complete, you'll notice “Success” within the progress bar that would eventually turn green:
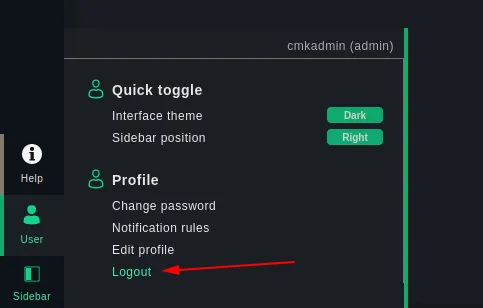
At this stage, I'll log out and will log back in to reconfirm that the server that I just added is indeed now being monitored by Checkmk:
Monitoring your server(s) with Checkmk
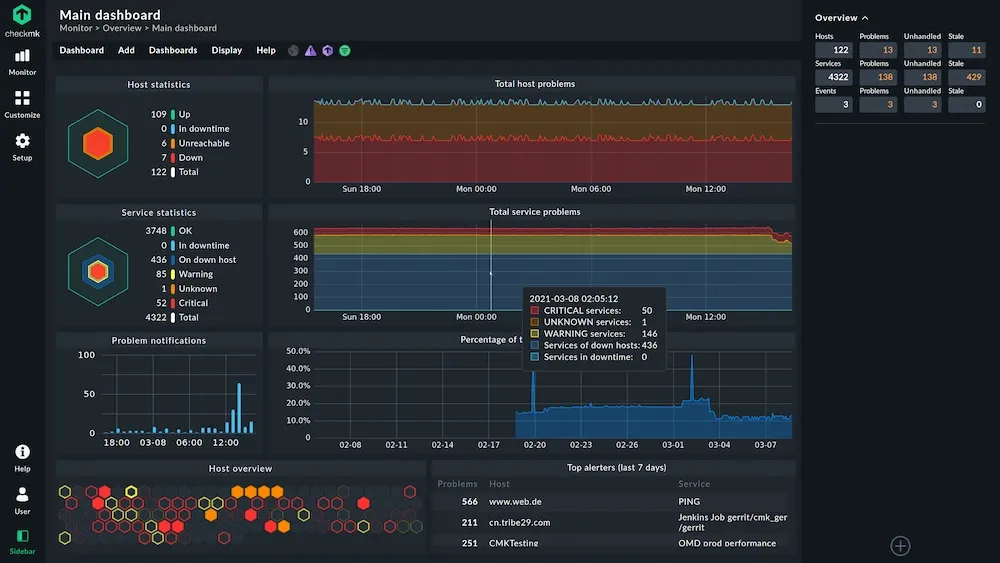
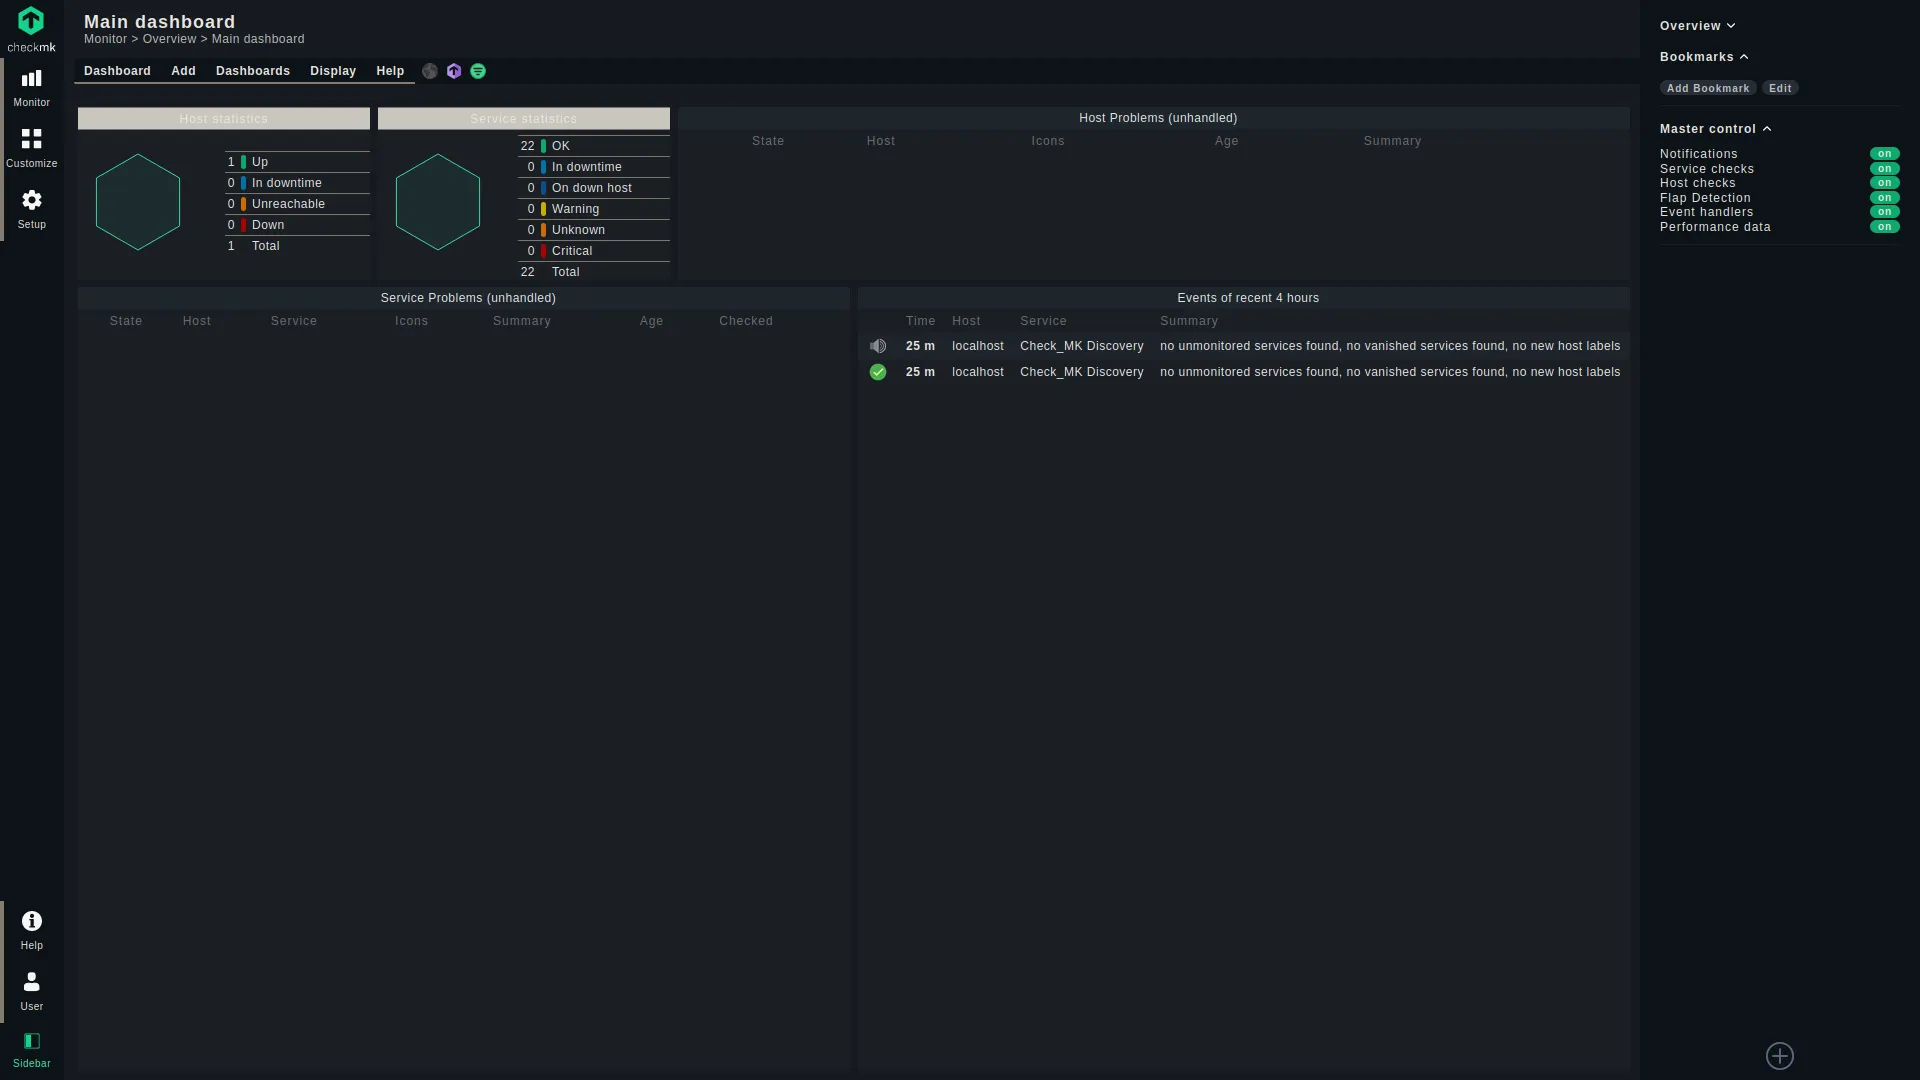
On successfully logging back again, you'd notice a green hexagon revealing your newly added server on the main dashboard:
Now, navigate to Monitor > System > Checkmk dashboard:
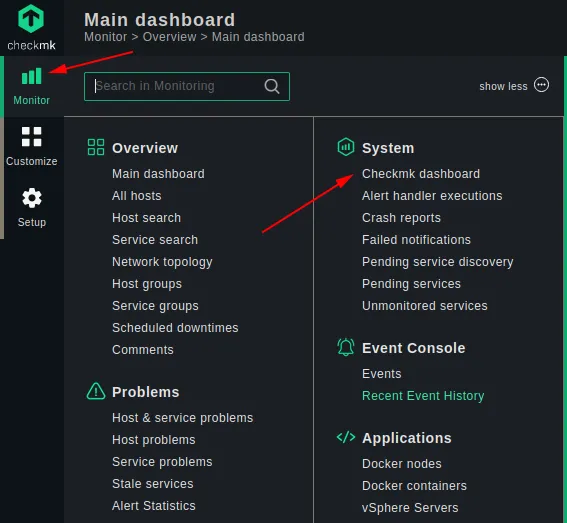
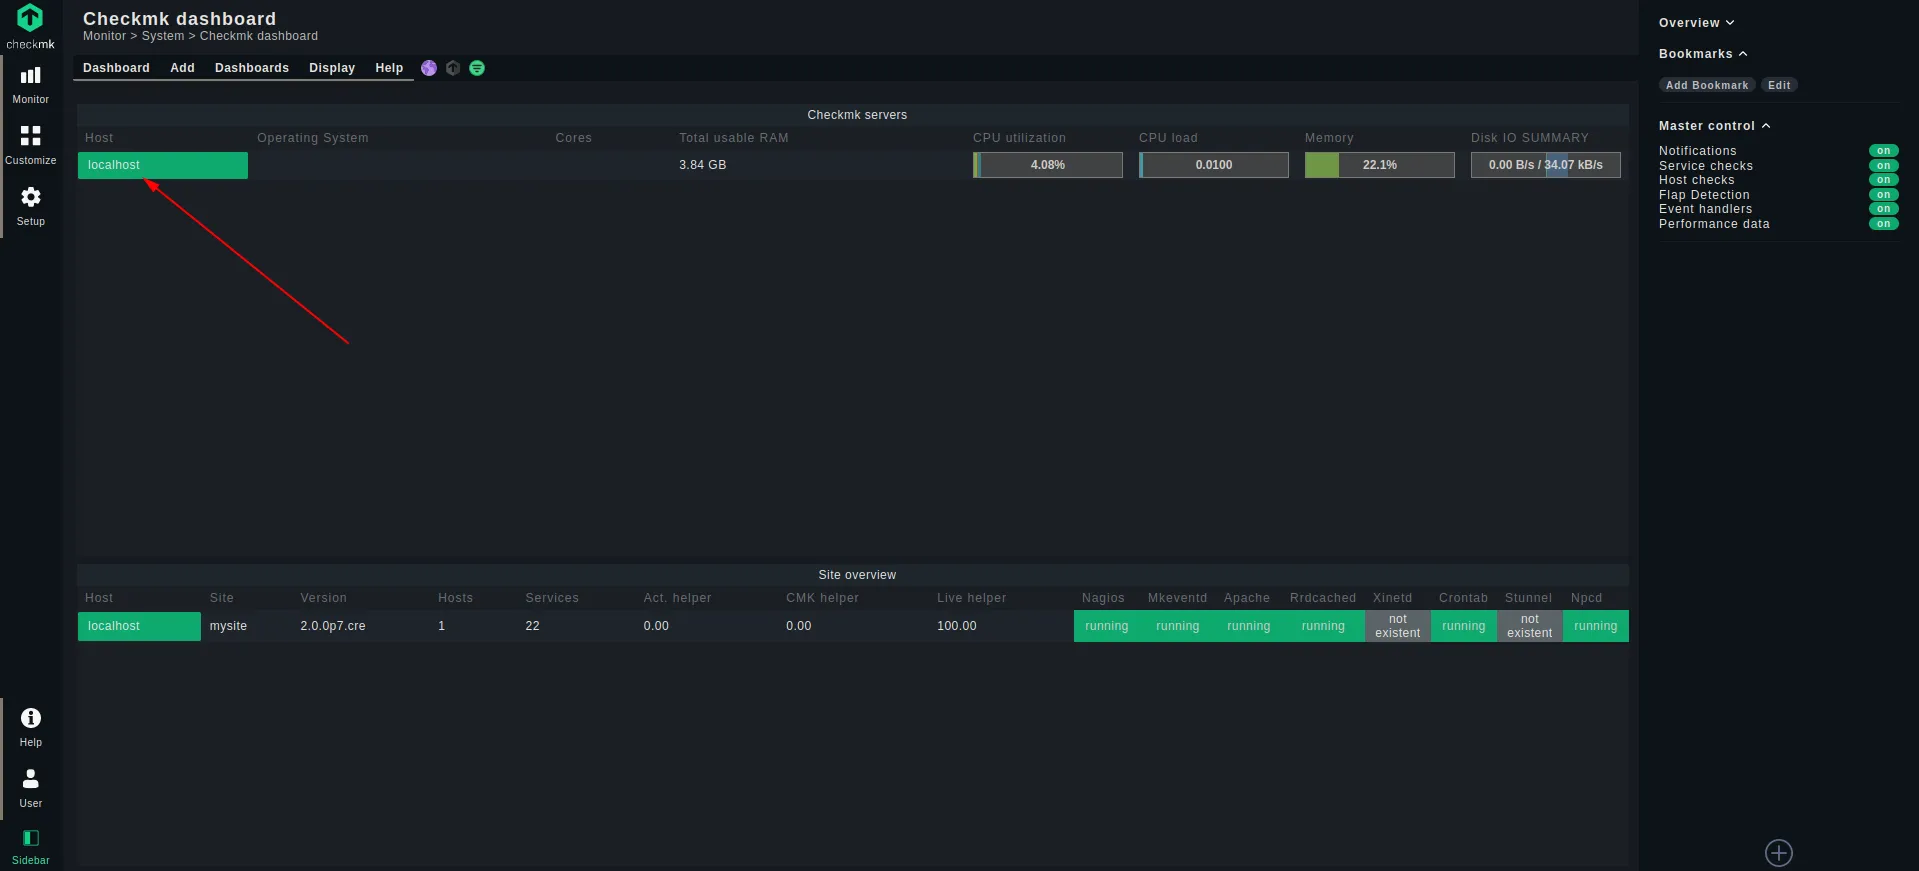
Note that it's different from the Main dashboard seen earlier on first login after adding the host. On this Checkmk dashboard, you can see a very brief monitoring overview of your server. Click on localhost:
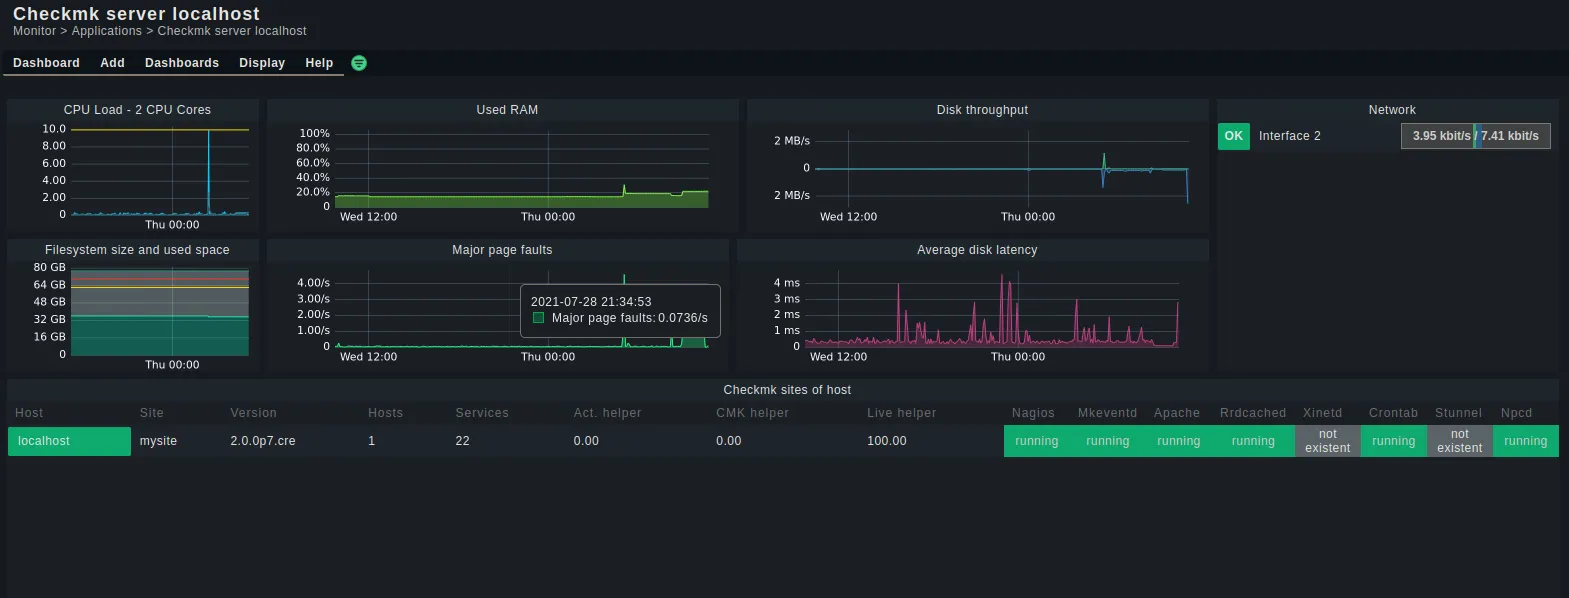
Once you click on it, you will finally see the generic monitoring page for a server, consisting of the commonly known metrics, namely:
- CPU Load
- Used RAM
- Disk throughput
- Filesystem size and used space
- Major page faults
- Average disk latency
- Network
You have to navigate to this interface in the above described manner every time you wish to monitor your server. But, you can also create a bookmark based on the following URL to open it quickly for regular access:
http://localhost/mysite/check_mk/dashboard.py?host=localhost&name=checkmk_host&site=mysiteIn the above URL, replace localhost with your own server's IP or domain. Also, replace mysite with the site name you set.
Bonus Tip: Metric Specific Monitoring
If you want to monitor server specific metrics in vivid detail, Checkmk's got you covered. For example, if you want to monitor CPU load or usage in-depth and individually, follow the below steps:
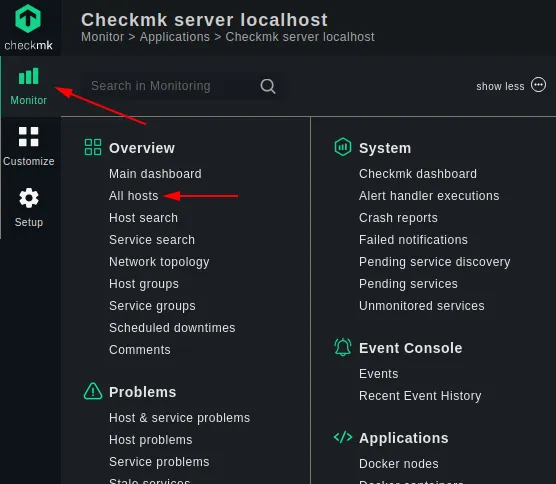
Navigate to Monitor > Overview > All hosts
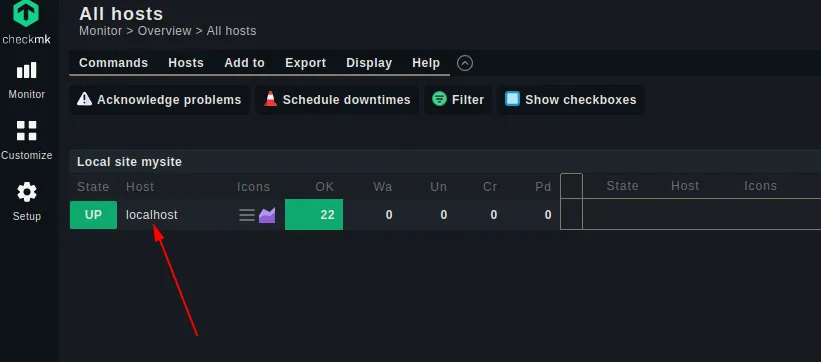
Click on localhost:
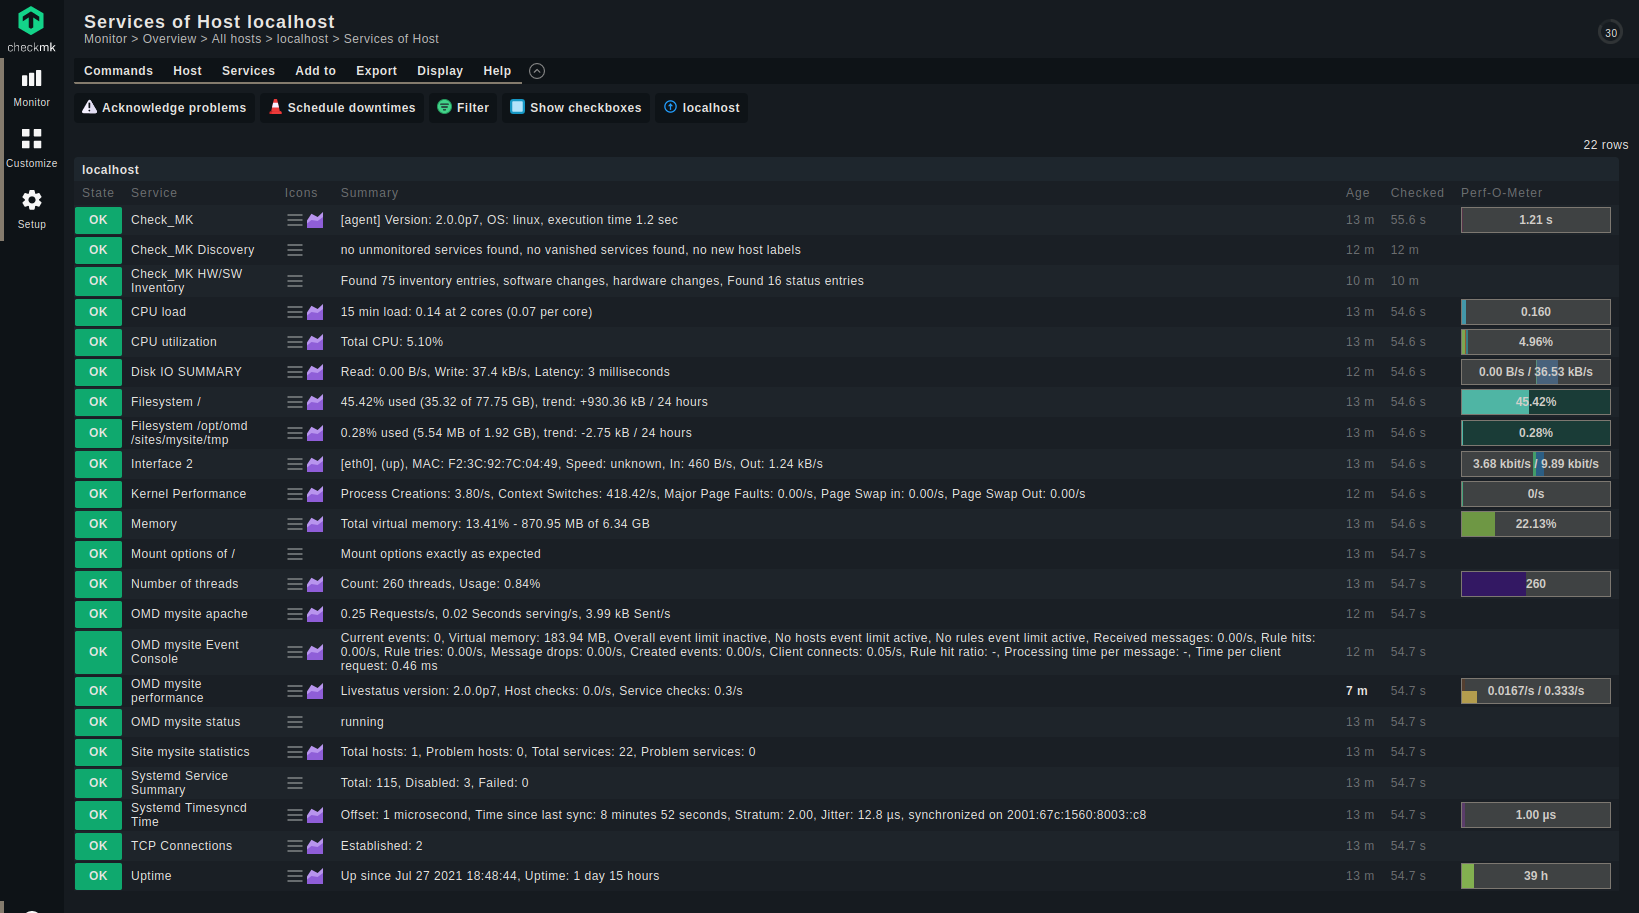
Now click on “CPU load” or “CPU utilization”. Notice, there are so many other metrics for you to monitor on an individual basis.
Here, I've selected “CPU load”:
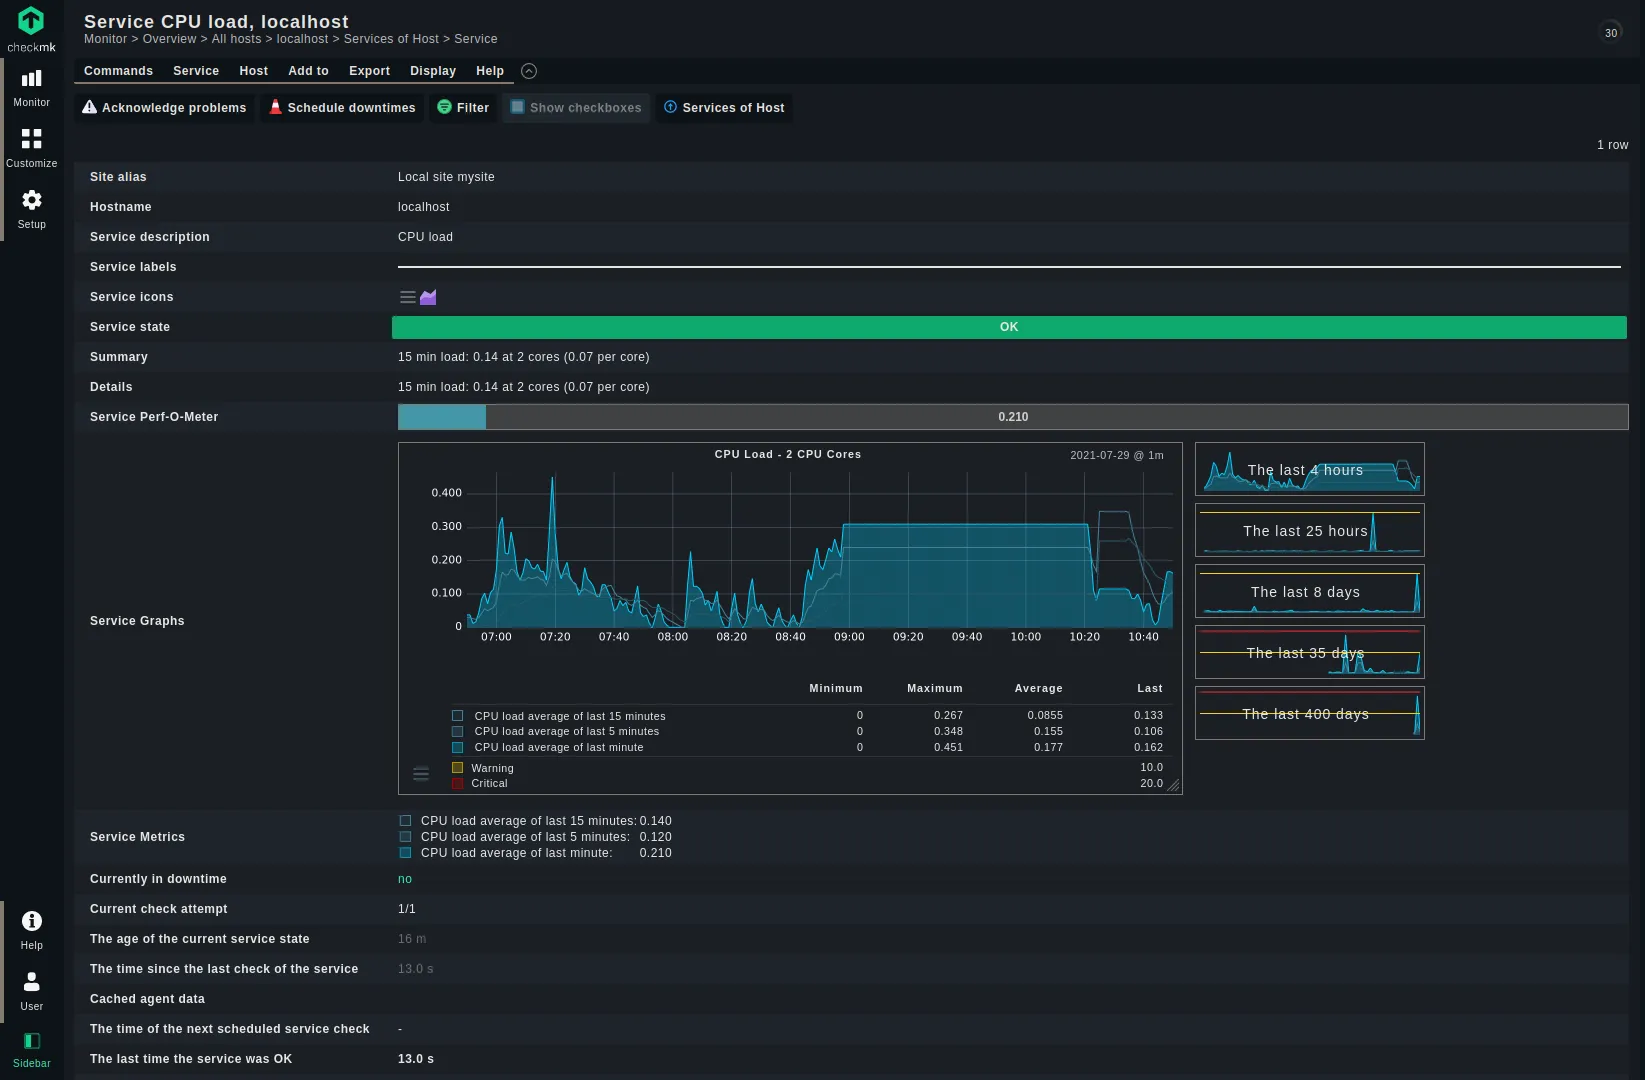
As you can observe, this detailed metric on Checkmk allows monitoring CPU load based on a variety of time-based parameters.
I do hope you find this guide useful and try out this promising tool on your own, be it your server or even your desktop system. If you would like to add any feedback, thoughts or comments, please do so in the section below.
