
We have covered monitoring solutions in the past as well. That was a huge list but it consists of all kinds of offering including the managed ones.
This is why I decided to create this list of infrastructure monitoring solutions that can be
Netdata
Netdata is an open-source monitoring solution that can be deployed as an on-premises solution. They also offer managed cloud-based solution if you don't want to self host it.
Here are some key features of Netdata:
- Installed locally: Netdata is installed directly on the servers, VMs, or containers being monitored, instead of running on a remote server. This makes it possible to collect and analyze data with low latency.
- Designed for performance: Netdata is built to collect thousands of metrics per server with low overhead. It uses an efficient database and algorithms to store and process data.
- Customizable dashboards: It provides a web-based dashboard that can be customized to display the metrics that matter most to your environment.
- Alerting and notifications: Alert notifications are a strong point of Netdata. Certain alerts are set by default like disk and space usage. You can also create your own alerts thanks to its dynamic configuration manager. Alerts can be sent via email, Slack etc.
- Integrates with existing tools: Netdata can integrate with other monitoring tools and data sources via plugins and APIs. Thus, it complements existing monitoring stacks.
- Scalable architecture: While Netdata runs locally, it can be scaled to monitor many servers by using a central "netdata cloud" for aggregation and visualization. This allows monitoring large environments.
At Linux Handbook, we use Netdata's hosted service to monitor our servers and we love this extendable but easy to use tool.
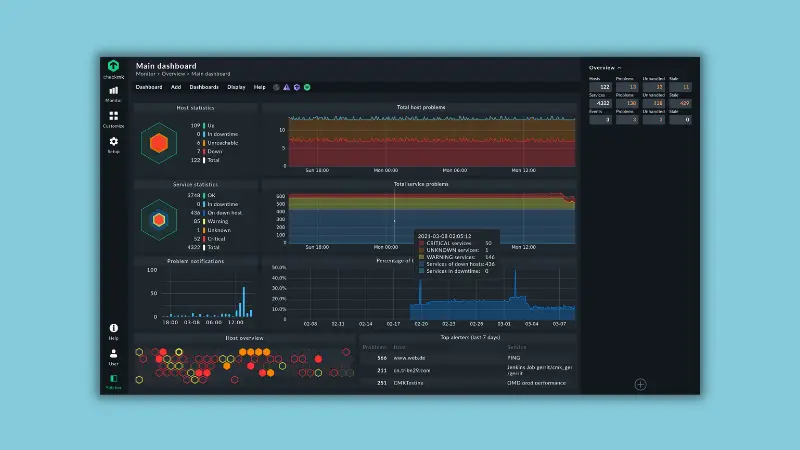
Checkmk
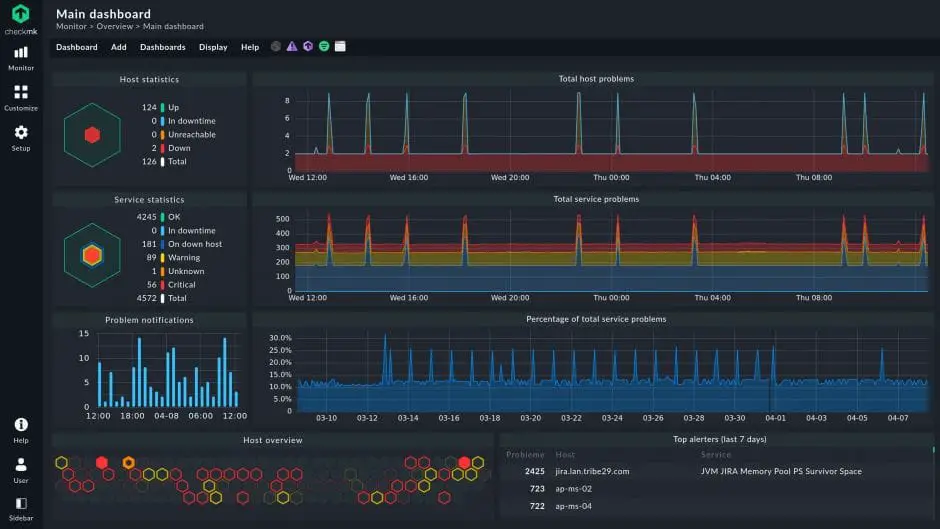
Checkmk is another open source tool you can trust for your infrastructure monitoring. Beautiful dashboard, powerful visualization, log and event monitoring, notification and alert, you get everything with this tool.
- Wide range of monitoring capabilities: Checkmk supports monitoring of servers, networks, applications, containers, and cloud infrastructure. It has over 2,000 vendor-maintained plugins to collect metrics from a variety of systems.
- Scalable architecture: A single Checkmk instance can monitor hundreds of servers and services. It claims to use a distributed architecture to scale to millions of devices across many sites without performance issues.
- Auto-discovery and configuration: Checkmk can automatically discover hosts and services to monitor, and provide relevant metrics and thresholds with minimal manual configuration.
- Flexible monitoring options: Checkmk supports both agent-based monitoring and agentless monitoring via protocols like SNMP, WMI, SSH, etc.
- Dashboards: It provides powerful dashboards to visualize data and analyze the state of the IT infrastructure.
- Alerting and notifications: It supports escalation workflows and integrates with tools like ServiceNow, Slack, etc. for notifications.
We have a detailed tutorial on setting up Checkmk in case you are interested.
Zabbix
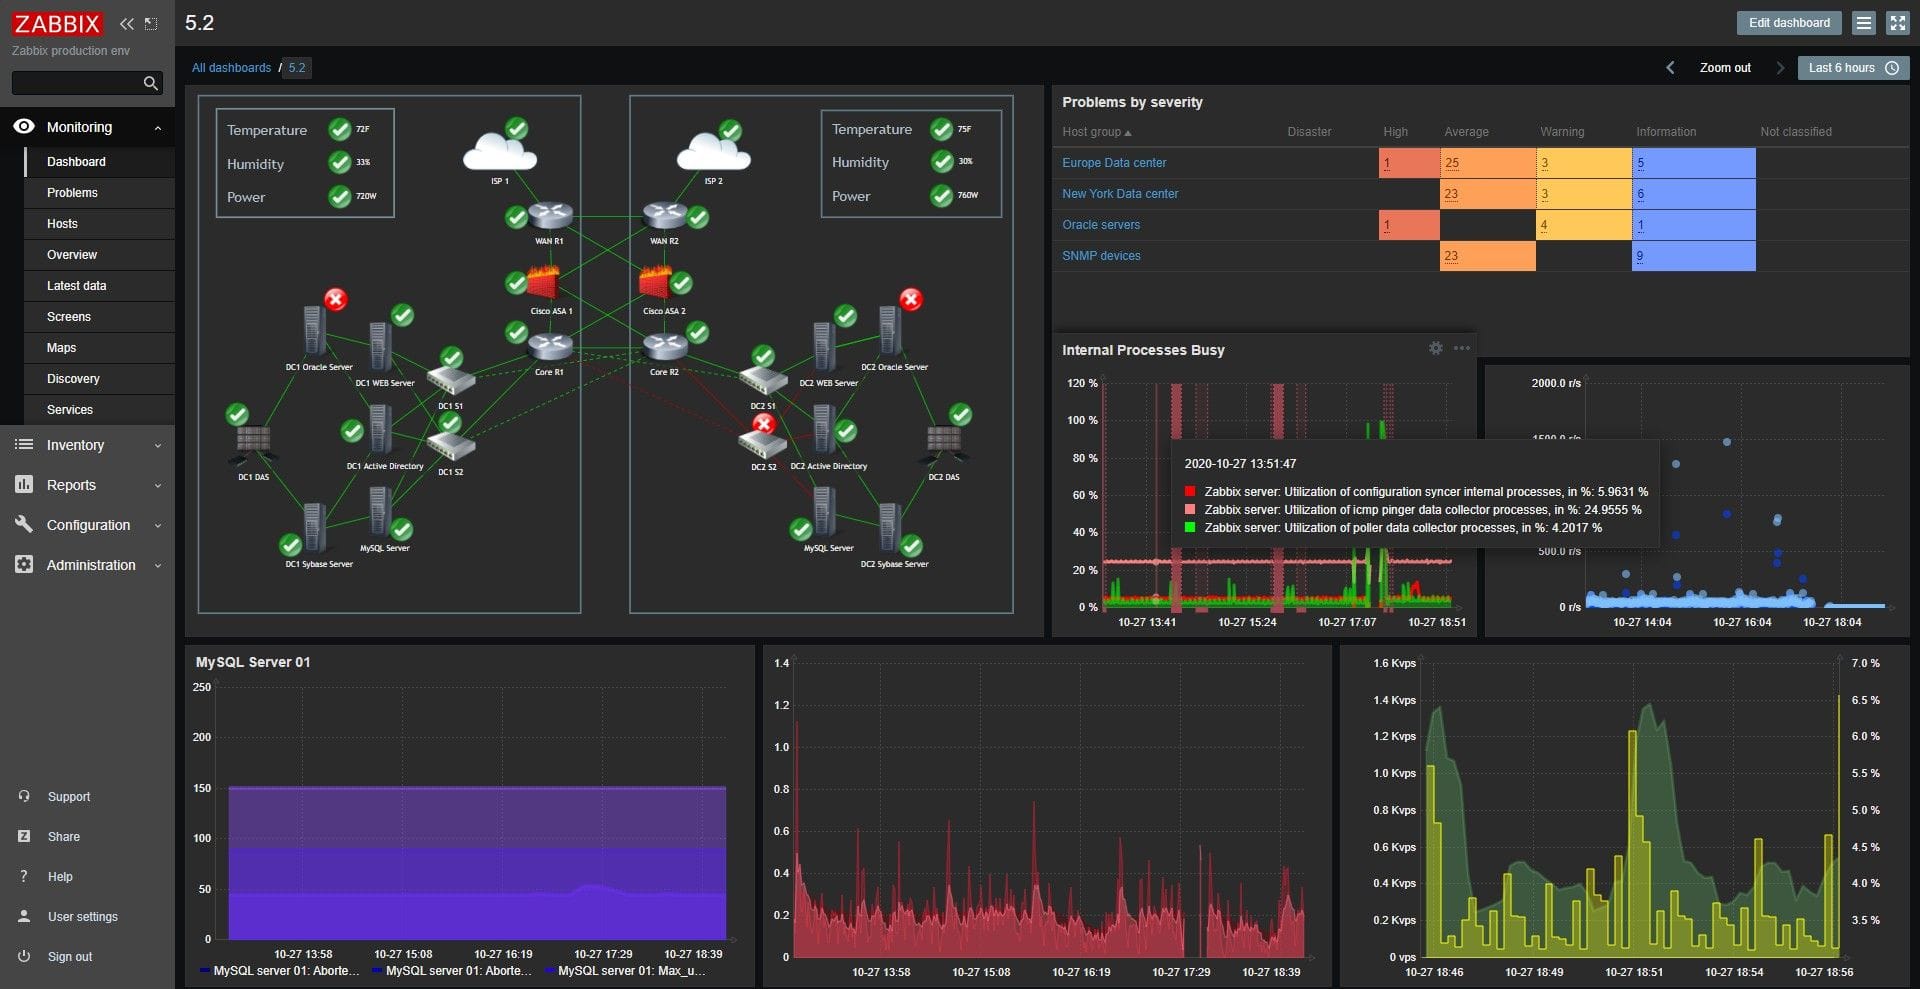
Zabbix is a comprehensive open source monitoring solution that can be deployed on-premises to monitor IT infrastructure.
- Scalable architecture: Zabbix is capable of monitoring millions of metrics from thousands of servers and devices. It can be implemented as a single instance or in a distributed architecture for large-scale environments.
- Wide range of monitoring capabilities: It supports monitoring of servers, networks, applications, databases, cloud infrastructure, and more. It has over 100 predefined templates for popular technologies.
- Flexible deployment options: Both agent-based and agent-less monitoring is supported.
- Auto-discovery and configuration: Zabbix can automatically discover hosts and services to monitor, and apply predefined templates to provide relevant metrics and thresholds with minimal manual configuration.
- Visualization and dashboards: Zabbix provides powerful visualization capabilities including graphs, charts, maps, and dashboards to display the status and performance of the monitored infrastructure.
- Alerting and notifications: Zabbix can send alerts and notifications when problems are detected. It supports escalation workflows and integrates with external tools for notifications.
Datadog
Although Datadog itself is not an open source solution, it does offer an on-prem monitoring solution.
- Agen-based monitoring: Datadog provides a lightweight agent that can be installed directly on servers and hosts to collect metrics and events.
- Metrics collection: The Datadog Agent collects metrics from hosts and containers at high resolution (15-second granularity) to provide detailed visibility into performance.
- Integrations: Datadog has over 500 turn-key integrations with popular technologies to monitor a wide range of on-premises systems, including servers, databases, middleware, and applications.
- Tagging and analytics: Datadog allows you to tag infrastructure components with metadata like operating system, service, or location. This enables tag-based search and analytics to slice and dice metrics and create fine-grained alerts.
- Dashboards: You get pre-built and customizable dashboards to visualize the health and performance of on-premises infrastructure. You can create dashboards to track key metrics and identify issues.
- Alerting: It offers machine learning-based alerting to proactively detect anomalies and issues in on-premises systems. You can set up alerts based on thresholds or anomaly detection.
- Unified platform: Datadog combines infrastructure monitoring with application performance monitoring, log management, and other capabilities in a single platform. This allows correlating on-premises infrastructure metrics with related traces, logs, and events.
Progress WhatsUp Gold
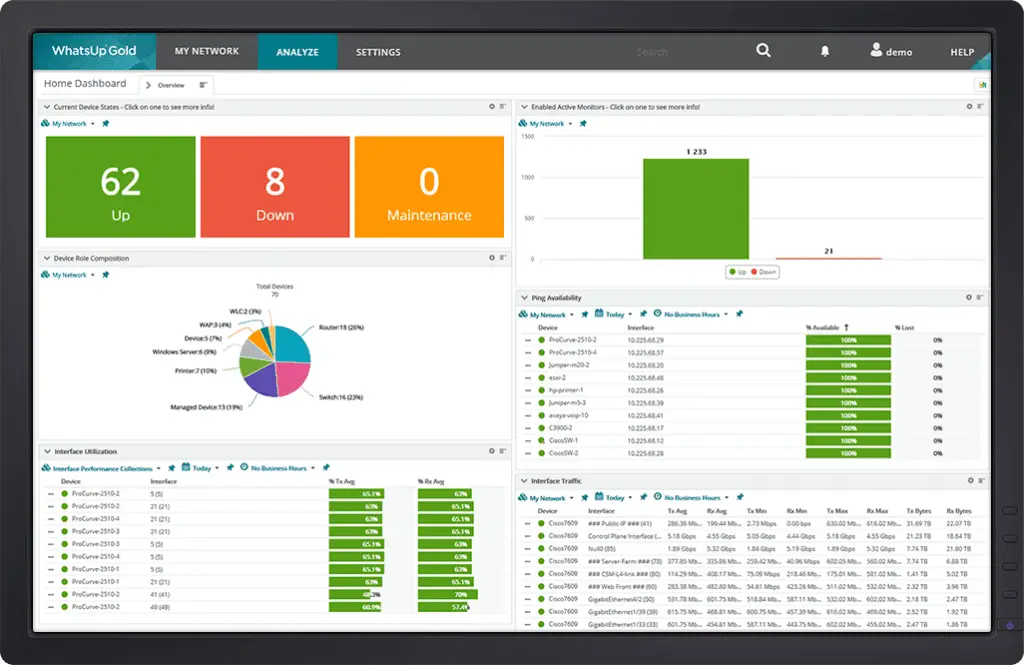
Weird name aside, Progress WhatsUp Gold is a network monitoring solution that can be deployed on-premises and also offers cloud-based options for organizations that prefer managed services. It provides full visibility into network performance and availability, helping IT teams maintain uptime and optimize resources.
- Monitor Anything: Servers, network devices, wireless infrastructure, and virtual environments using SNMP, WMI, and SSH.
- Custom Dashboards & Maps: Visualize dependencies and performance with interactive maps and NOC views.
- Proactive Alerts: Centralized alerting with customizable notifications to prevent downtime.
- Traffic & Performance Analysis: Track CPU, memory, bandwidth, and analyze traffic patterns with network traffic analysis.
- Automation: Streamline configuration, log, and asset management for operational efficiency.
WhatsUp Gold combines on-prem control with cloud flexibility, making it a scalable solution for modern network monitoring. There is a generous free tier and you can always try it out with a 30 day free trial here.
Conclusion
There are many more on-prem infrastructure monitoring solutions like Prometheus, ManageEngine, etc.
Personally, I have used Netdata the most here and it is the one I currently use for my work and home servers and I am quite happy with them.
Of course, one size doesn't fit all, and your requirements and preferences may not match mine exactly.
I suggest going over the recommended infrastructure monitoring products mentioned here and see which one fits your needs.