

You've already seen how to monitor CPU and memory usage with top and htop. Now, let's take a look at two other tools you can use for monitoring your system: iotop and ntopng. These tools monitor disk I/O (Input/Output) and network traffic, respectively. This tutorial will show you how to install, configure, and use both tools.
What are iotop and ntopng?
iotop:
Similar in appearance to top and htop, iotop is a real-time disk I/O monitoring utility that displays the current activity (reads, writes, and waiting) of each process or thread on a Linux system. It can also show total accumulated usage per process/thread. It's useful for identifying processes that are generating heavy I/O traffic (reads/writes) or causing bottlenecks and high latency.
ntopng:
As the name suggests, ntopng is the next-generation version of ntop, a tool for real-time network-traffic monitoring. It provides analytics, host statistics, protocol breakdowns, flow views, and geolocation, helping you spot abnormal usage. Unlike iotop (and the older ntop command), ntopng primarily serves its output through a web interface, so you interact with it in a browser. While this tutorial also covers basic console usage, do note that it's more limited on the CLI.
Installing iotop and ntopng
Both tools are available for installation on Ubuntu and most other distros in their standard repositories.
For Debian/Ubuntu and their derivatives:
sudo apt update && sudo apt install -y iotop ntopng
To install ntopng, RHEL, CentOS, Rocky, and AlmaLinux users will need to enable the EPEL repository first:
sudo dnf install -y epel-release
sudo dnf install -y iotop ntopng
For Arch-based distros, use:
sudo pacman -Syu --noconfirm iotop
ntopng is available from the AUR.
For openSUSE, run:
sudo zypper refresh && sudo zypper install -y iotop ntopng
Enable ntopng if you'd like it to run constantly in the background:
sudo systemctl enable --now ntopng
If you'd like to disable this behavior and only use ntopng on demand, you can run:
sudo systemctl stop nntopng && sudo systemctl disable ntopng
Using iotop for monitoring disk I/O
Much like top and htop, iotop runs solely as a CLI tool. It requires root permissions, but not to worry, it is only used for monitoring purposes and cannot access or control anything else on your system.
sudo iotop
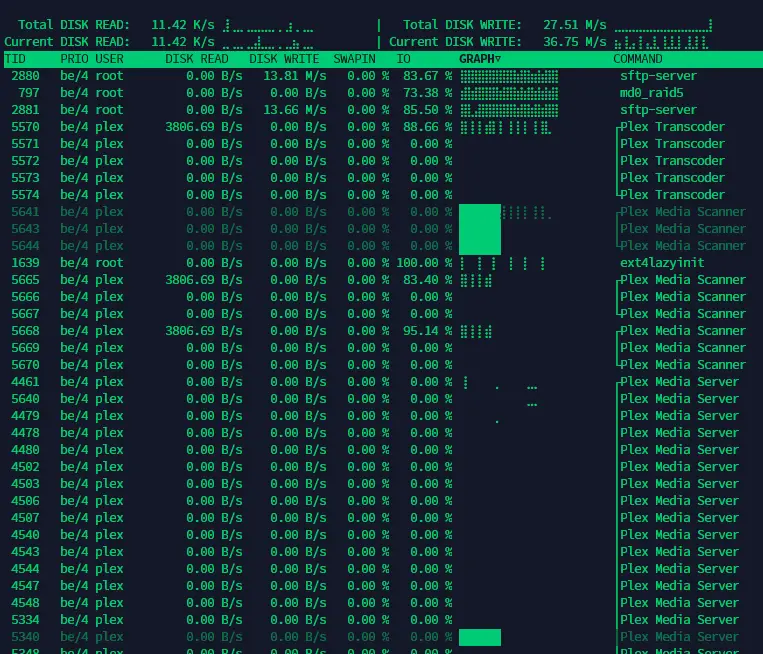
You’ll see something like this:
At the top, the following real-time readouts are displayed (all in Kilobytes):
- Total DISK READ: cumulative amount of data read from disk since iotop started.
- Total DISK WRITE: cumulative amount of data written to disk since start.
- Current DISK READ: how much data is being read (per second).
- Current DISK WRITE: how much data is being written (per second).
Below these outputs, there are several columns shown by default:
- TID: Thread ID (unique identifier of the thread/process).
- PRIO: I/O priority level (lower number = higher priority).
- USER: The user owning the process/thread.
- DISK READ: Data read from disk by this thread/process.
- DISK WRITE: Data written to disk by this thread/process.
- SWAPIN: Percentage of time spent swapping memory in/out.
- IO> (I/O): Percentage of time the process waits on I/O operations.
- COMMAND: The name or command of the running process/thread.
Useful options & key bindings
You can control what iotop shows by default by passing various flags when launching the command. Here are some of the commonly used options:
- -o (or --only): Only show processes with current I/O (filter idle processes).
- -b (or --batch): Non-interactive mode (useful for logging).
- -n <count>: Outputs several iterations, then exits (runs in batch mode).
- -d <delay>: Delay between iterations (in seconds). For instance, use -d 5 for a 5-second delay, or -d 0.5 for a half-second delay. The default is one second.
When run without "-b/--batch", iotop starts in interactive mode, where you can use the following keys to change various options:
- o: toggles the view between showing only processes currently doing I/O and all processes running on the system.
- p: toggles between displaying only processes or all threads. Changes "TID" (Thread ID) to "PID" (Process ID).
- a: toggles accumulated I/O vs current I/O.
- r: Reverse sort order (toggles ascending/descending).
- left/right arrows: Change the sort column (move between columns like DISK READ, COMMAND, etc.).
- HOME: Jump to sorting by TID (Thread ID).
- END: Jump to sorting by COMMAND (process name).
- q: quits iotop.
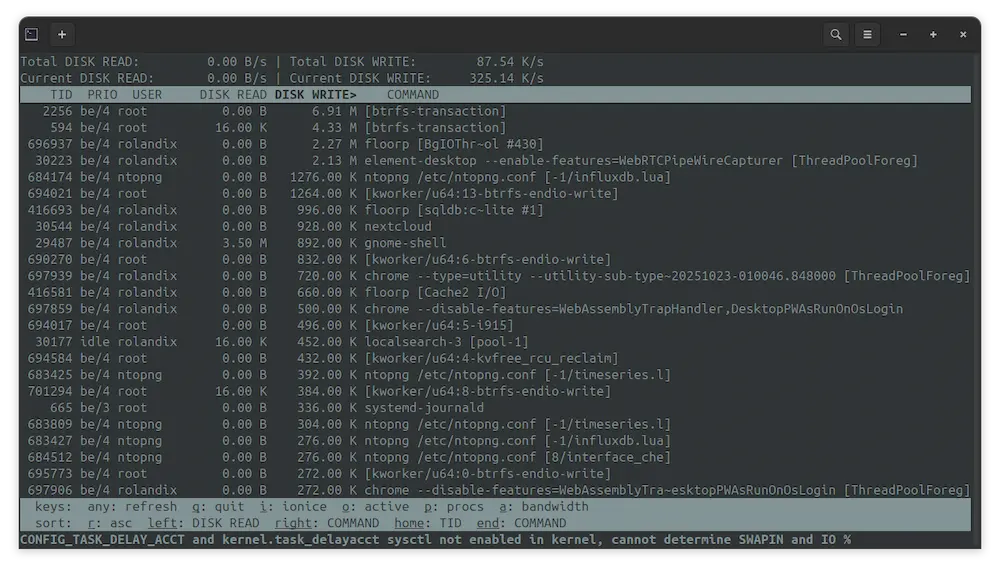
Practical example scenario where iotop helps you as a sysadmin
Let's say you're working on your system and you notice that it's suddenly slowing down, but can't find the cause via the normal means (high CPU or memory usage). You might suspect disk I/O is the bottleneck, but this will not show up in most system monitoring tools, so you run "sudo iotop" and sort by DISK WRITE. There, you notice a process is constantly writing hundreds of MB/s, blocking other processes.
Using the "o" keybinding, you filter to only active writers. You may then throttle or stop that process in another tool (like htop), reschedule it to run at off-hours, or have it use another storage device.
iotop has its limitations
While it is a useful monitoring tool, iotop cannot control processes on its own. It only has access for reading activity, not controlling it. Some other key things to note with this tool are:
- On systems with many threads/processes doing I/O, sorting/filtering is key. It's recommended that you use "-o" when launching the command, or press "o" after you've started it.
- iotop shows process-level I/O, but does not always give full hardware device stats (for that, tools like iostat or blktrace may be needed).
- You should avoid running iotop on production systems for long intervals without caution, since iotop itself causes overhead when many processes are updating at the same time.
Exploring ntopng to get graphical view of network traffic
Unlike iotop and its older variant, ntop (which is no longer packaged on some distros), ntopng is primarily accessed via a web-based GUI at default port 3000.
For example: http://your-server-ip-address:3000 or if you're running it on your locallyr, from https://localhost:3000.
From the GUI, you can view hosts, traffic flows, protocols, top talkers, geolocation, alerts, etc. To keep things simple, we'll cover basic usage and features.
Changing the default port
Changing the port is a good idea if you already use port 3000 for other local web services.
To change ntopng’s default web port, edit its configuration file and restart the service.
sudo nano /etc/ntopng/ntopng.conf
Then, change the line defining the web port. If it doesn't exist, add it:
-w=3001
You can use any unused port above 1024.
Next, you'll need to restart ntopng:
sudo systemctl restart ntopng
You should now see ntopng listening on port 3001.
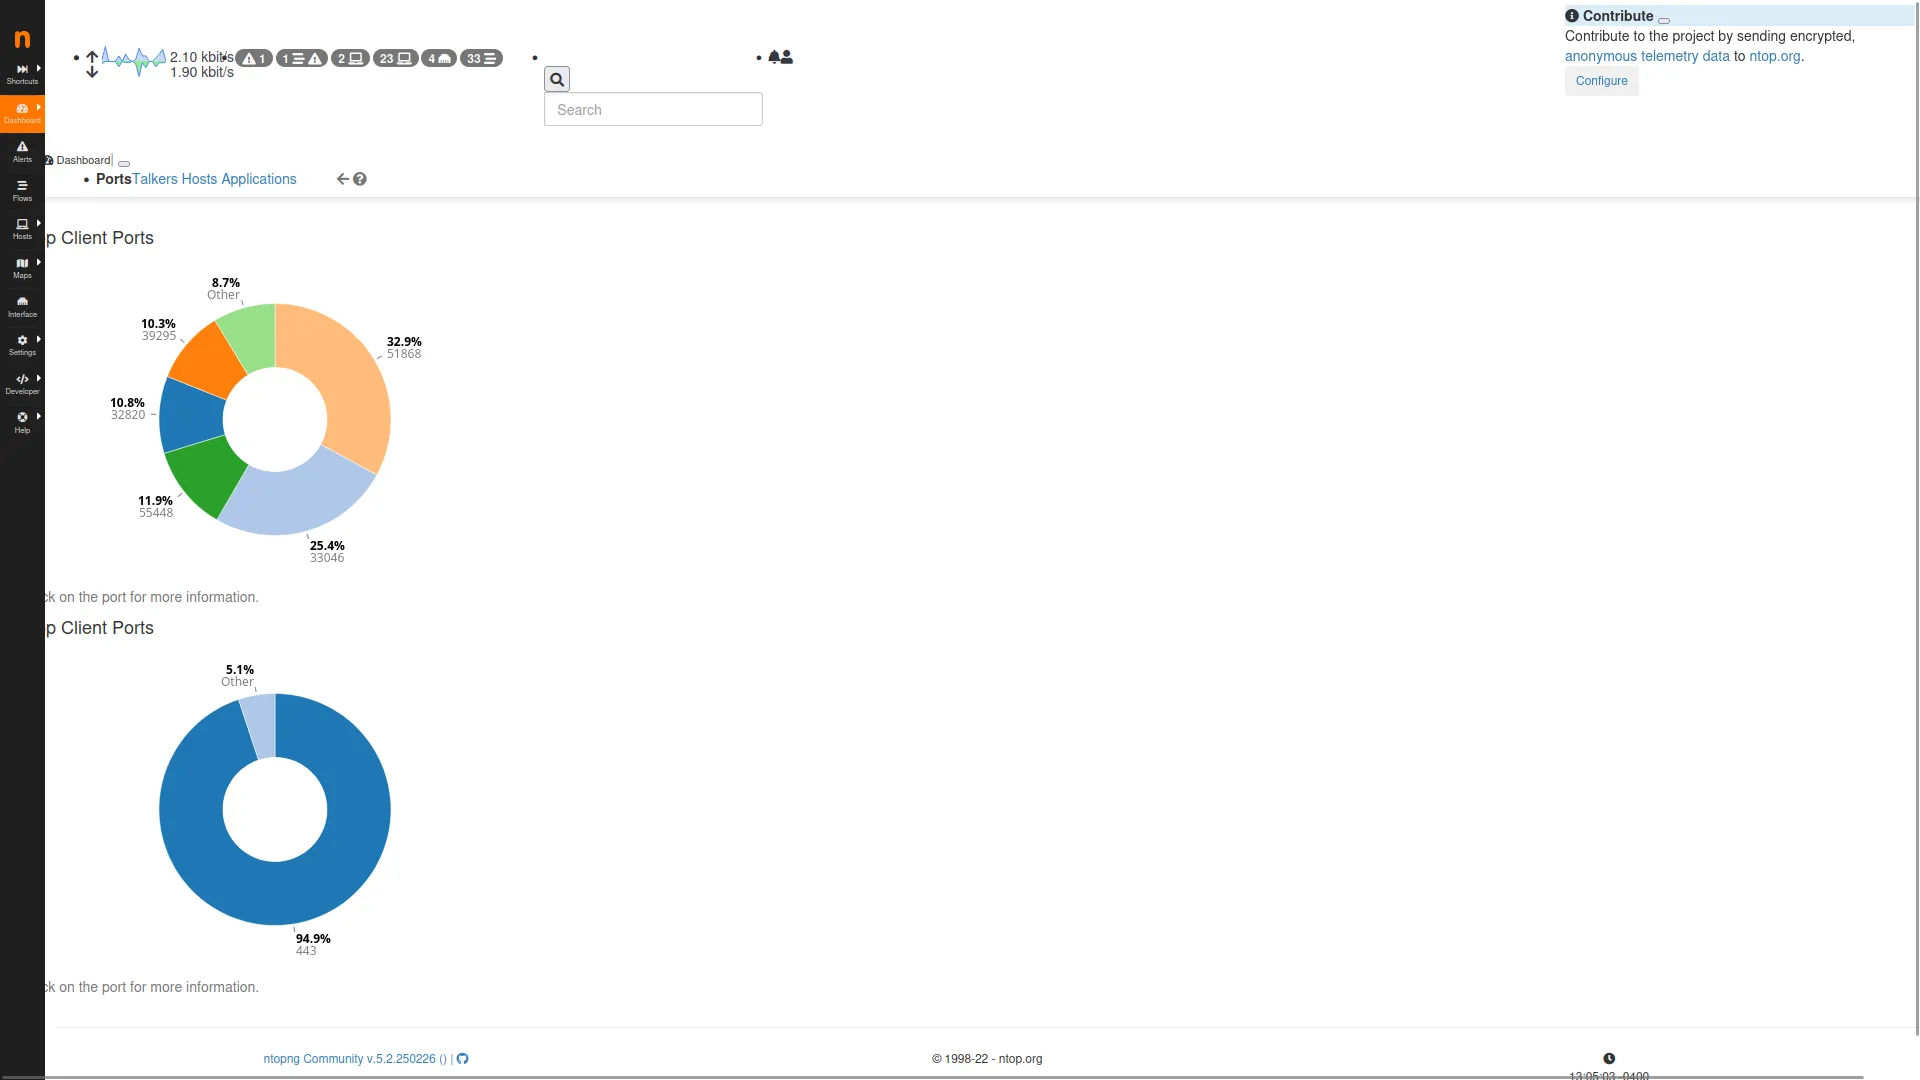
Dashboard overview
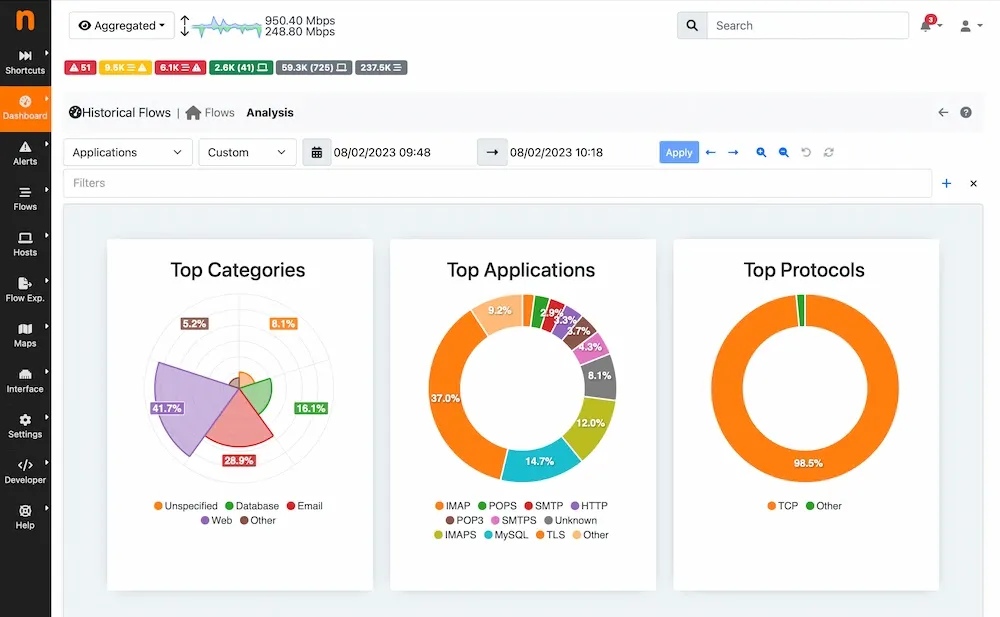
Once you're logged in, you'll land on the main dashboard, which looks like this:
This dashboard provides a real-time visual overview of network activity and is usually the first thing you see.
By default, the dashboard includes:
- Traffic summary (top left): shows live inbound and outbound traffic rates, number of active hosts, flows, and alerts. Clicking on any of these will take you to the relevant section.
- Search bar (top center): lets you quickly find hosts, IPs, or ports.
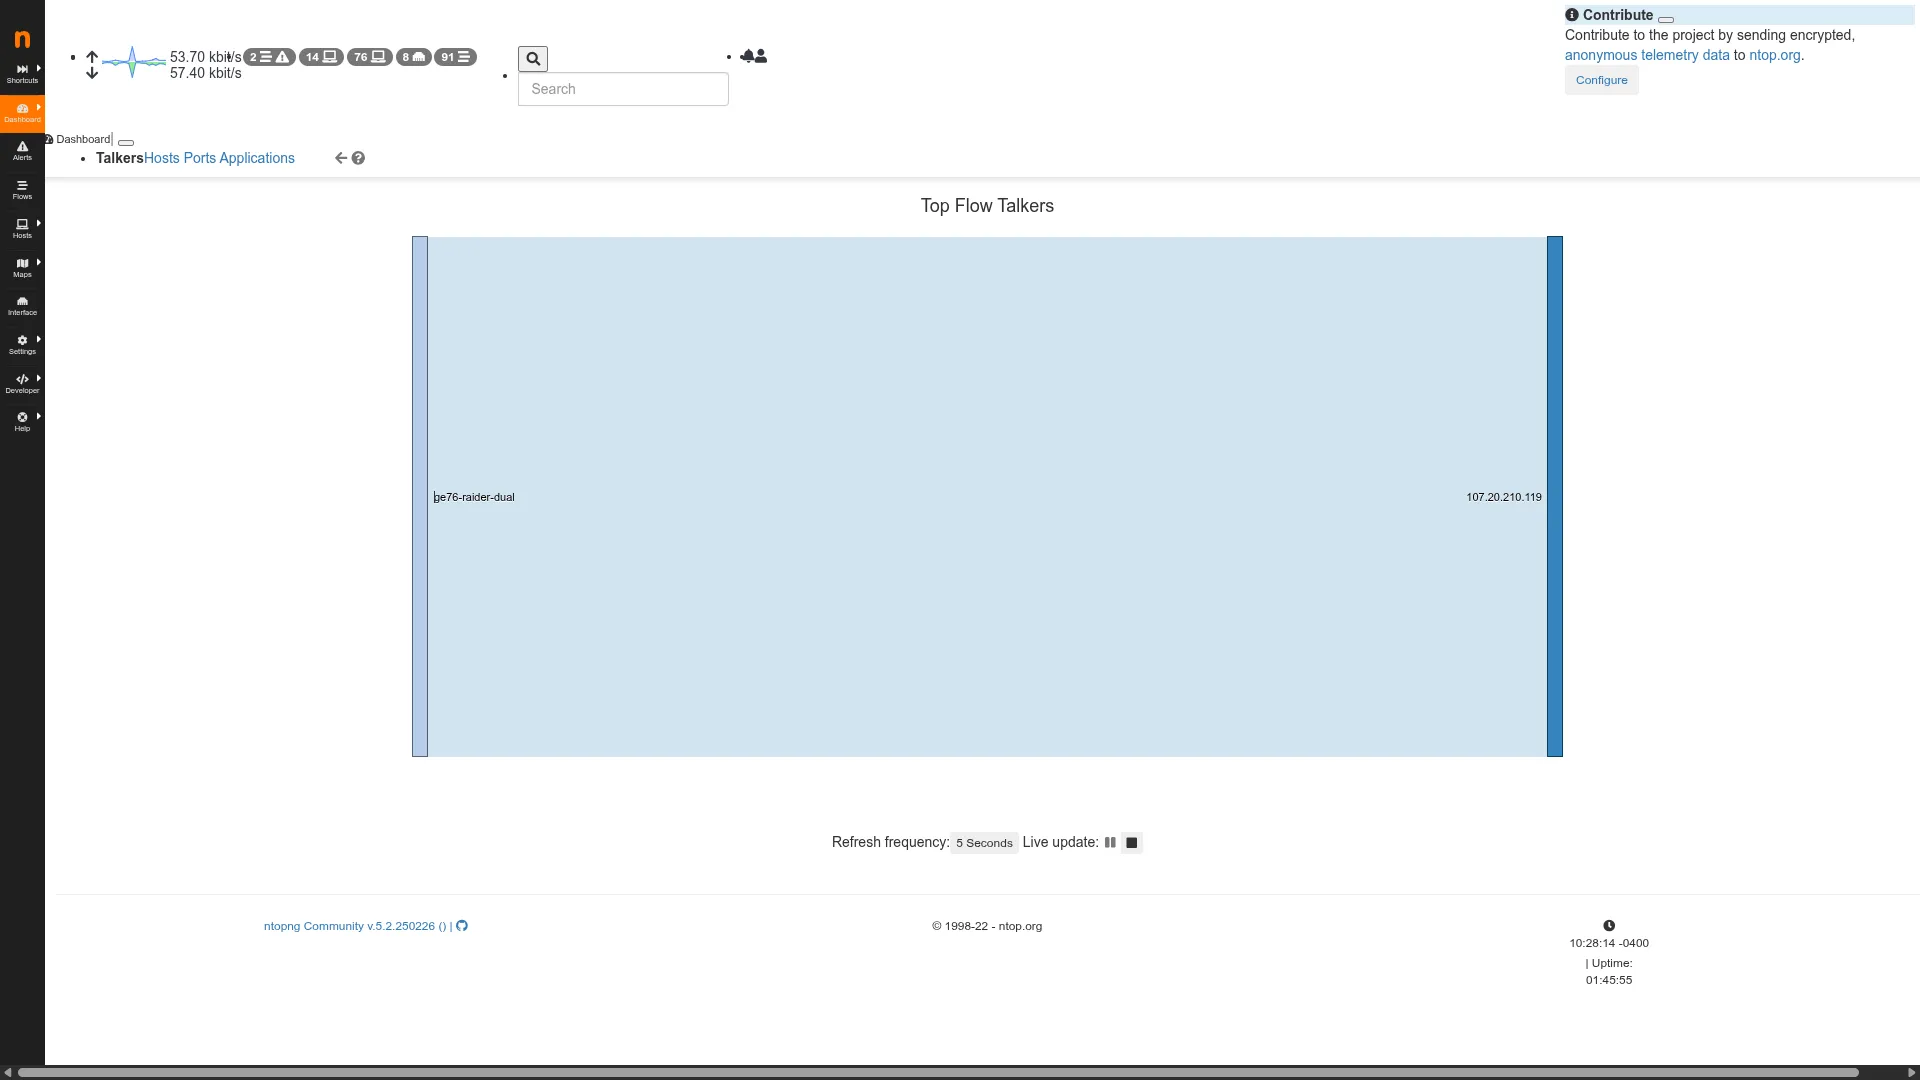
- Top Flow Talkers (main panel): a large visual block showing which hosts are generating or receiving the most traffic (e.g., your machine vs. external IPs).
- Sidebar (left): navigation menu with access to:
- Dashboard: current view.
- Alerts: security or threshold-based notifications.
- Flows/Hosts/Ports/Applications: detailed breakdowns of network activity.
- Interfaces: network interfaces being monitored.
- Settings / System / Developer: configuration and data export options.
- Refresh indicator (bottom): shows the live update frequency (default: 5 seconds).
- Footer: version information, uptime, and system clock.
You can check each panel in the sidebar and dashboard individually to see what each displays. For this tutorial, we won't go into every detail, as there are too many to cover here.
Using ntopng from the console
Although ntopng is designed to be primarily web-based, you can still run it directly in the console for quick checks or lightweight monitoring. This can be useful on headless systems over SSH, or when you just want a quick snapshot of network activity without loading the web UI.
First, stop the ntopng systemd service:
sudo systemctl stop ntopng
This is necessary to avoid any conflicts between the running service and your access via the CLI.
Now you can launch ntopng directly:
sudo ntopng --disable-ui --verbose
This command will listen on all network interfaces that ntopng can find. If you'd like to restrict to a certain interface, you can use the -i flag.
For example, to listen only on your WiFi interface, you can use either of the following commands (usually begins with "wl"):
ip link | grep wl
or
nmcli device status | grep wl
Then run ntopng, pointed to your wifi router:
sudo ntopng --disable-ui --verbose -i wlp49s0
Replace "wlp49s0" with your device, of course.
Basic logging with the ntopng CLI
If you'd like to capture a basic log with ntopng from the console, you can run:
sudo ntopng --disable-ui -i wlp49s0 --dump-flows flows.log
Again, just remember to replace wlp49s0 with your device name. Note that the log will save to which ever folder is your current working directory. You can change the location of the log file by providing a path, for example:
sudo ntopng --disable-ui -i wlp49s0 --dump-flows path/to/save/to/flows.log
Practical example scenario where ntopng helps
Say you suspect unusual network activity on your system. You log in to the ntopng dashboard and notice that one host on your network is sending a large amount of data to an external IP address over port 443 (HTTPS).
Clicking on that host reveals its flows, showing that a specific application is continuously communicating with a remote server. Using this insight, you can then open another monitoring tool, such as top or htop, to identify and stop the offending process before investigating further.
Even for less experienced users, ntopng is a great way to understand a system’s network usage at a glance. You can run it on a production server if resources allow, or dedicate a small monitoring host to watch other devices on your network (out of scope here).
By combining real-time views with short-term history (e.g., spotting periodic traffic spikes), you can build a picture of network health. Used alongside a firewall and tools like fail2ban, ntopng helps surface anomalies quickly so you can investigate and respond.
ngtopng has its limitations too
While ntopng is powerful, capturing all network traffic at very high throughput can require serious resources (NICs, CPU, memory). If you're using it on a high-traffic network, it's probably best to use a separate server for monitoring. Here are some other important things to note:
- If you are monitoring remote networks or via VLANs, you may need an appropriate network setup (mirror ports, network taps). However, these are outside the scope of this tutorial.
- For data retention out of the box, you only get a limited history. For long-term trends, you'll need to configure external storage or a database.
- Most traffic (e.g., HTTPS) is encrypted, so ntopng can only show metadata (hosts, ports, volumes, SNI (Server Name Indication) where available). In such cases, it cannot show the actual payloads.
Conclusion
iotop and ntopng are two powerful free/open-source tools that can help you monitor, analyze, and troubleshoot critical subsystems on your Linux machine. By incorporating these into your arsenal, you'll get a better understanding of your system's baseline for normal operations and be better equipped to spot anomalies or bottlenecks quickly.
