

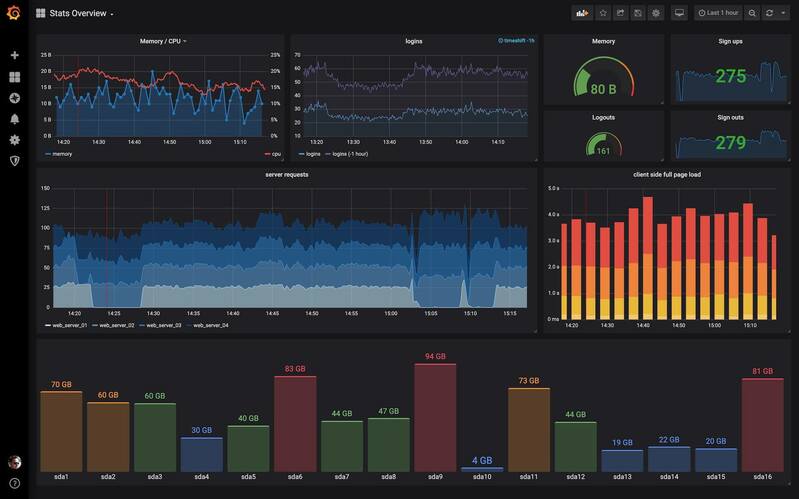
Grafana is one of the most famous open source tools for monitoring and get information from several data sources. It’s well known for its beautiful and clean dashboards, where it can be easily set and configured. It can provide awesome graphs and manage alerts to help the user to take the right actions.
Grafana supports an enormous number of databases. The main use of Grafana is displaying information by time series data, like CPU, memory and hard disk usage over time. But you are free to create all kind of hosts (devices to monitor) and grab everything that is measurable. You can monitor data centers, printers, routers, IoT devices and so on.
Another big advantage of this amazing software is that it is available for all operating systems, Linux, Mac and Windows. The community is vibrant and develops many plugins to improve the data visualization.
Requirements for Grafana
To run Grafana you will need to guarantee the minimum requirements, such as a supported operating system, database and browser.
Supported operating systems
- Debian, Ubuntu, RPM-based distros (CentOS, Fedora, OpenSuse, RedHat)
- macOS and Windows
Minimum hardware
- Minimum recommended memory: 255 MB
- Minimum recommended CPU: 1
If you intend to use a lot of databases and dashboards, a more powerful machine is recommended.
Supported Databases:
Grafana is flexible and supports a lot of databases.
Supported web browsers:
The official documentation recommends using the following browsers to view the Grafana dashboard:
- Chrome/Chromium
- Firefox
- Safari
- Microsoft Edge
You may use other options, since JavaScript is enable. But for precaution, use one of the list above.
Installing Grafana on Ubuntu or Debian
In this article, I will show you how to install Grafana on an Ubuntu or Debian-based system.
The easy way is to download the latest Grafana version in the form of .deb package. But this way, your Grafana install won’t get future updates and you’ll have to manually install the newer version.
This is why the better way is to add it to your repository list and then install the latest stable release. This way, your Grafana install gets regular updates.
In the terminal, add this command to use apt over https:
sudo apt-get install -y apt-transport-httpsNow enable the software-properties-common package so that you can add additional repositories:
sudo apt-get install -y software-properties-common wgetUse wget to get the GPG key and add it to your system:
wget -q -O - https://packages.grafana.com/gpg.key | sudo apt-key add -Rest is easy. Update the software repository cache:
sudo apt-get updateAnd then install Grafana:
sudo apt-get install grafanaNow that you have installed Grafana, let’s see how to set it up properly.
Configuring Grafana
Let’s start Grafana service:
sudo systemctl daemon-reloadsudo systemctl start grafana-serverYou should also enable this service so that Grafana is started at each system boot:
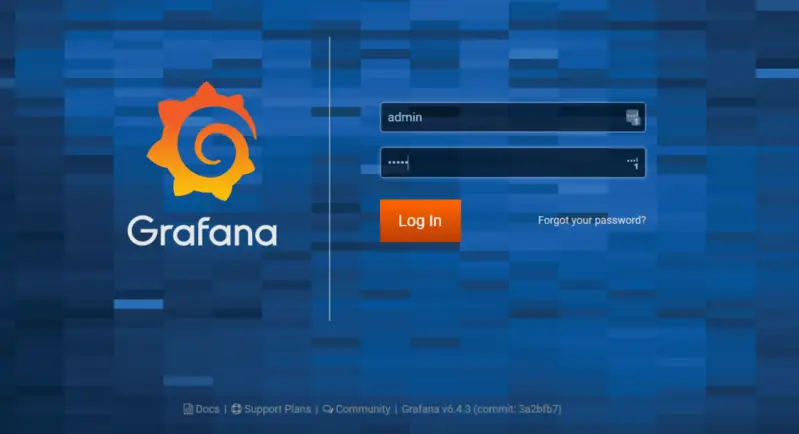
sudo systemctl enable grafana-server.serviceGrafana works like a web service, so you need to access it from a browser. Open your browser and go to http://localhost:3000/.
In the login page use the default username and password. Use the IP address of the machine if you are accessing Grafana on a different machine in your network. The 3000 is the default HTTP port. It’s possible to change it if you want.
- username: admin
- password: admin
It’s highly recommend to create a new user with a strong password. After that, you can disable or delete the default admin user for security purposes.
Setting up your first dashboard
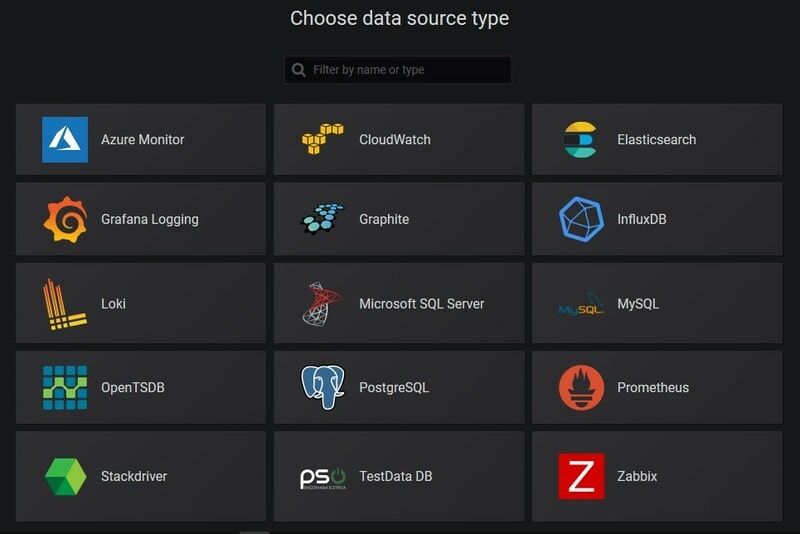
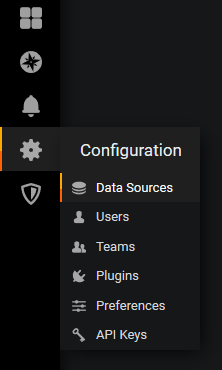
Before starting to monitor anything, you need to include your database in the configuration menu.
After you have configured your data source you are ready to continue and design the dashboard.
To create graphs and indicators is easy, you have a lot of options and all of them are well documented on the Grafana website. You just have to explore it a bit.
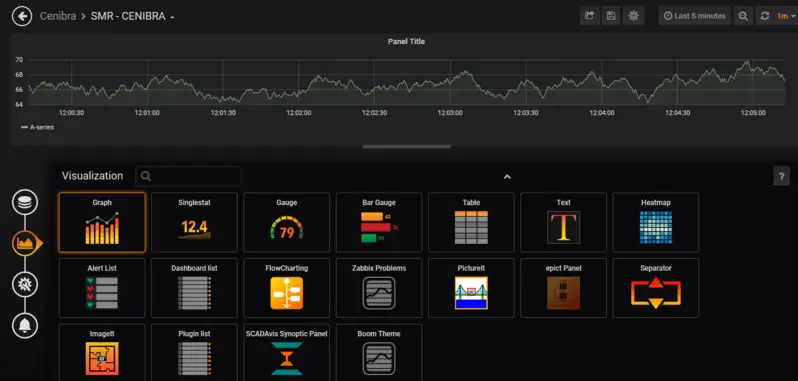
Now it’s up to you to use your creative potential and construct beautiful dashboards.
Written by Marcelo Melo
