
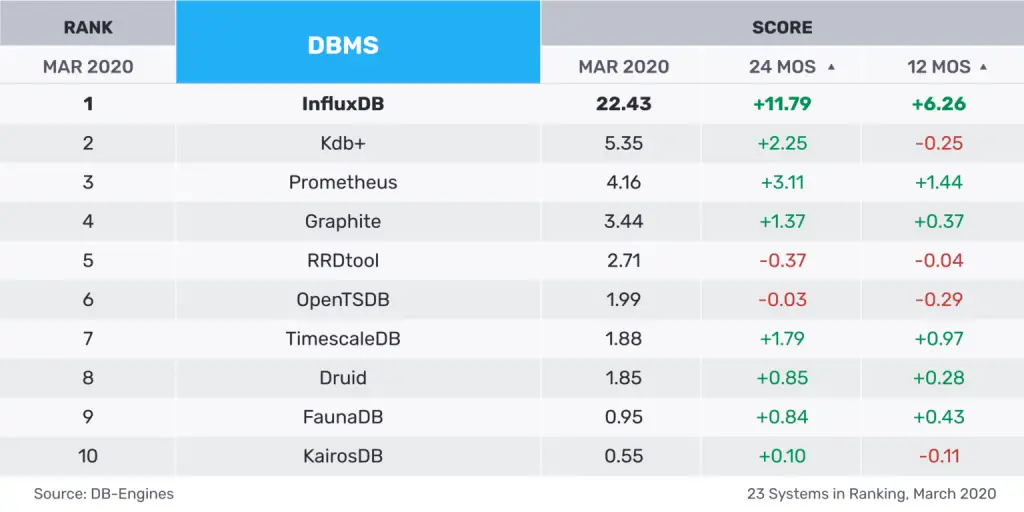
In an earlier article about monitoring, I described how install and configure Grafana. In this tutorial, I’ll show you how to install and use one of the most famous open source time series databases in Grafana. It’s called InfluxDB and it is growing super fast in the last few years with infrastructure and application monitoring and IoT monitoring and analytics.
What is a time series database?
A time series database (TSDB) is a database with a goal to store information over time. To give some examples of information to record over time, sensor data, application performance monitoring, network data, and many other types of analytics data can be stored and use the resources and the advantages of InfluxDB.
A TSDB has some characteristics that make it unique from other databases. These include time-stamp data storage and compression, data life cycle management, data summarization, ability to handle large time series dependent scans of many records, and time series aware queries.
Installing InfluxDB on Linux
This section will show how to install InfluxDB version 1.7 on your Linux distribution. You can find the instructions on the official downloads page as well.
On Ubuntu & Debian based Linux distributions, use the following commands one by one:
wget https://dl.influxdata.com/influxdb/releases/influxdb_1.7.10_amd64.deb
sudo dpkg -i influxdb_1.7.10_amd64.deb
On Red Hat & CentOS based Linux distributions, use the following commands one by one:
wget https://dl.influxdata.com/influxdb/releases/influxdb-1.7.10.x86_64.rpm
sudo yum localinstall influxdb-1.7.10.x86_64.rpm
Prerequisite: Bring your data to the databse
Remember that Grafana works on various database (InfluxDB in this case here). It’s your responsibility to bring this data to the database so that it logs the information you want to monitor in the InfluxDB. This is not the focus of this article, but you can use a lot of languages and other tools to populate your tables.
By the way, in InfluxDB, we don’t have tables, they are called measurements. For example, any back-end language can be used to interact with the sensor or any other device you’re capturing information to store in the database. You can use Node.js, Python, Java and so on.
Here is a list of InfluxDB API client libraries.
Using InfluxDB in Grafana
Luckily, Grafana comes with a powerful plug-in to import and use InfluxDB. The plug-in includes a custom query editor and supports annotations and query templates.
Add data source
For those who don’t like the to write commands to make things work, I have a good news for you. With Grafana, you don’t need to access terminal to configure anything. I’ll put some pictures to show how to include your InfluxDB in Grafana:
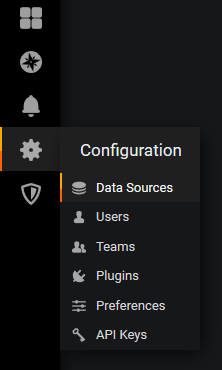
The first step is to add the database in the configuration area.
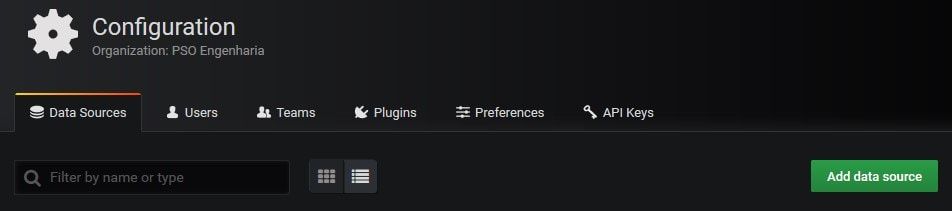
Click on the green bottom to add data source:
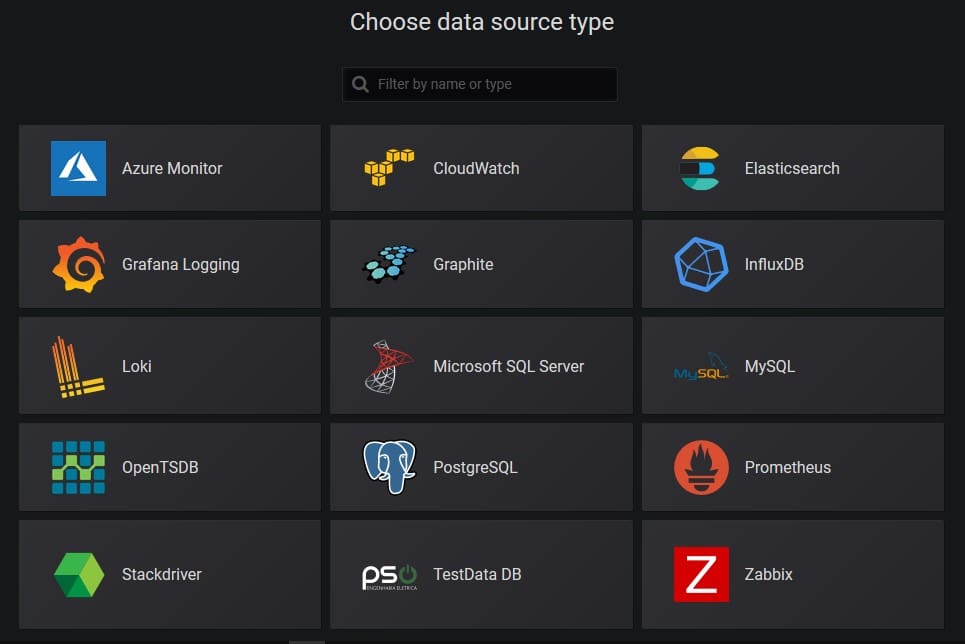
Choose InfluxDB:
Complete all the information about your database to Grafana be able to access it correctly.
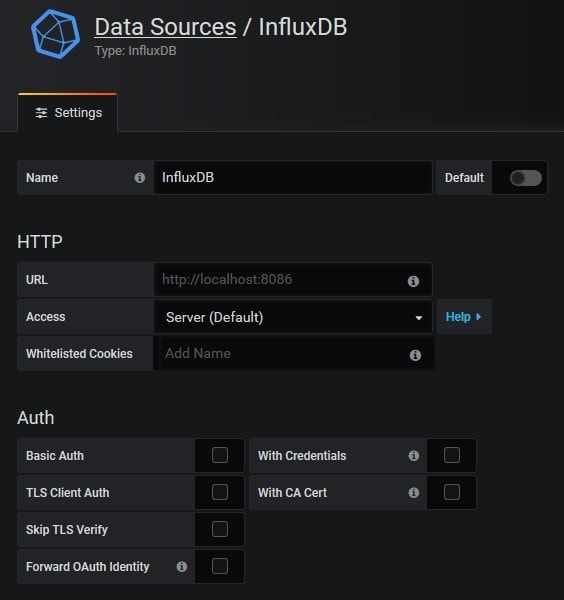
Finish to complete the information and click on the Save & Test button.
To give a more detailed explanation, the next table has more information about each field on this step.
| Name | Description |
|---|---|
| Name | The data source name. This is how you refer to the data source in panels and queries. |
| Default | Default data source means that it will be pre-selected for new panels. |
| Url | The HTTP protocol, IP address and port of your InfluxDB API (InfluxDB API port is by default 8086) |
| Access | Server (default) = URL needs to be accessible from the Grafana back-end/server, Browser = URL needs to be accessible from the browser. |
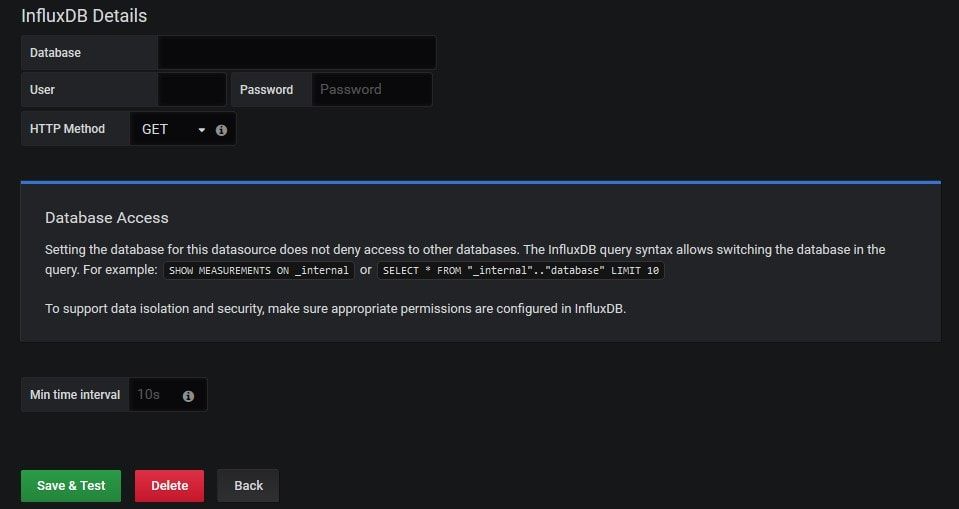
| Database | Name of your InfluxDB database |
| User | Name of your database user |
| Password | Database user’s password |
| HTTP mode | How to query the database (GET or POST HTTP verb). The POST verb allows heavy queries that would return an error using the GET verb. Default is GET. |
If you did all these steps right, a successful message is shown on the screen.
Configure a Dashboard with InfluxDB Metrics
At this stage, the difficult part is already done. All you need to do is use your creativity to create beautiful and useful dashboards with all your metrics from the database.
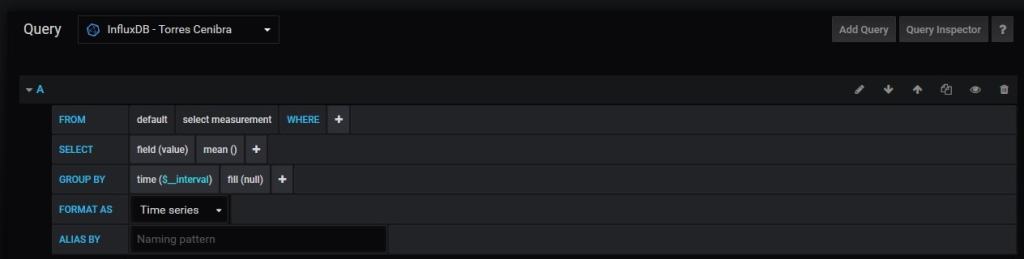
Grafana has a intuitive query editor to provide easy access to the measurements, fields, tags and values from the InfluxDB database.
You can access the InfluxDB editor under the metrics tab when you are in the edit mode of the Graph or Singlestat panels. Enter edit mode by clicking the panel title, and clicking Edit. The editor allows you to select metrics and tags.
Now it’s up to you, put your hands on the code and start to monitor something of your interesting. I suggest to begin with something easy, like a simple computer, a thermal sensor, etc. To end this topic, here is a fancy and complete dashboard with some metrics about a server monitoring.
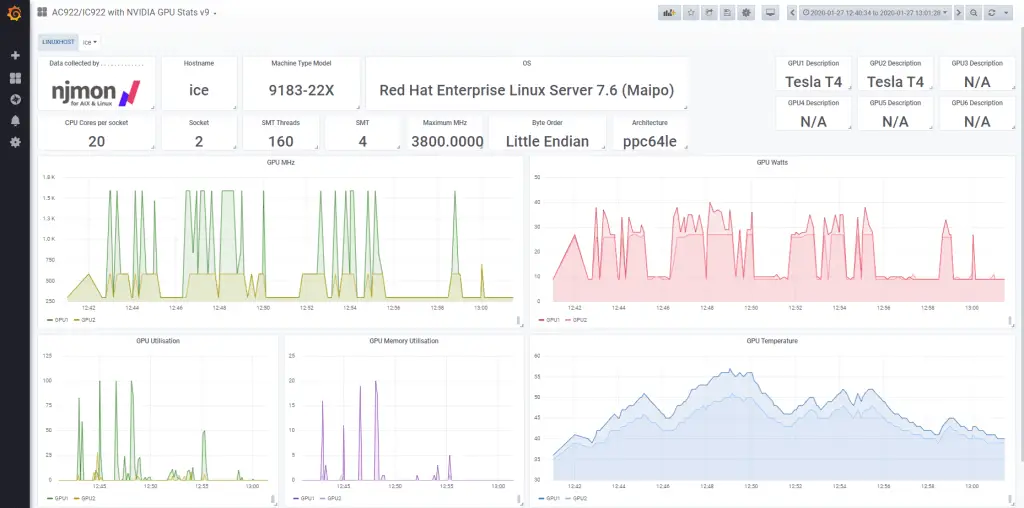
To have more ideas, visit Grafana Labs and visualize all the contribution of the community. Many users share their work there.
I hope you liked this quick little setup guide. Feel free to share your feedback in the comment section.
This article is written by Marcelo Melo and edited by Abhishek Prakash.
